UNITED STATES
SECURITIES AND EXCHANGE COMMISSION
Washington, D.C. 20549
FORM 10‑K
|
|
|
|
☒
|
ANNUAL REPORT PURSUANT TO SECTION 13 OR 15(d) OF THE SECURITIES EXCHANGE ACT OF 1934
|
|
For the fiscal year ended December 31, 2015
|
|
or
|
|
☐
|
TRANSITION REPORT PURSUANT TO SECTION 13 OR 15(d) OF THE SECURITIES EXCHANGE ACT OF 1934
|
Commission File No. 001‑36120
ANTERO RESOURCES CORPORATION
(Exact name of registrant as specified in its charter)
|
|
|
|
Delaware
(State or other jurisdiction of
incorporation or organization)
|
80‑0162034
(IRS Employer
Identification No.)
|
|
1615 Wynkoop Street
Denver Colorado
(Address of principal executive offices)
|
80202
(Zip Code)
|
(303) 357‑7310
(Registrant’s telephone number, including area code)
Securities Registered Pursuant to Section 12(b) of the Act:
|
|
|
|
Title of Each Class
|
Name of Each Exchange on which Registered
|
|
Common Stock, Par Value $0.01 Per Share
|
New York Stock Exchange
|
Securities Registered Pursuant to Section 12(g) of the Act: None.
Indicate by check mark if the registrant is a well‑known seasoned issuer, as defined in Rule 405 of the Securities Act. ☒ Yes ☐ No
Indicate by check mark if the registrant is not required to file reports pursuant to Section 13 or Section 15(d) of the Act. ☐ Yes ☒ No
Indicate by check mark whether the registrant (1) has filed all reports required to be filed by Section 13 or 15(d) of the Securities Exchange Act of 1934 during the preceding 12 months (or for such shorter period that the registrant was required to file such reports), and (2) has been subject to such filing requirements for the past 90 days. ☒ Yes ☐ No
Indicate by check mark whether the registrant has submitted electronically and posted on its corporate Website, if any, every Interactive Data File required to be submitted and posted pursuant to Rule 405 of Regulation S‑T (§232.405 of this chapter) during the preceding 12 months (or for such shorter period that the registrant was required to submit and post such files). ☒ Yes ☐ No
Indicate by check mark if disclosure of delinquent filers pursuant to Item 405 of Regulation S‑K (§ 229.405 of this chapter) is not contained herein, and will not be contained, to the best of registrant’s knowledge, in definitive proxy or information statements incorporated by reference in Part III of this Form 10‑K or any amendment to this Form 10‑K. ☐
Indicate by check mark whether the registrant is a large accelerated filer, an accelerated filer, a non‑accelerated filer, or a smaller reporting company. See the definitions of “large accelerated filer,” “accelerated filer” and “smaller reporting company” in Rule 12b‑2 of the Exchange Act.
|
|
|
|
|
|
Large accelerated filer ☒
|
Accelerated filer ☐
|
Non‑accelerated filer ☐
(Do not check if a
smaller reporting company)
|
Smaller reporting company ☐
|
Indicate by check mark whether the registrant is a shell company (as defined in Rule 12b‑2 of the Act). ☐ Yes ☒ No
The aggregate market value of the voting common stock held by non‑affiliates of the registrant as of June 30, 2015, the last business day of the registrant’s most recently completed second fiscal quarter, was approximately $2.6 billion.
The registrant had 277,061,336 shares of common stock outstanding as of February 19, 2016.
Documents incorporated by reference: Portions of the registrant’s proxy statement for its annual meeting of stockholders to be filed pursuant to Regulation 14A within 120 days after the registrant’s fiscal year end are incorporated by reference into Part III of this Annual Report on Form 10‑K.
CAUTIONARY STATEMENT REGARDING FORWARD‑LOOKING STATEMENTS
The information in this report includes “forward‑looking statements” within the meaning of Section 27A of the Securities Act of 1933, as amended (the “Securities Act”), and Section 21E of the Securities Exchange Act of 1934, as amended (the “Exchange Act”). All statements, other than statements of historical fact included in this Annual Report on Form 10‑K, regarding our strategy, future operations, financial position, estimated revenues and losses, projected costs, prospects, plans and objectives of management are forward‑looking statements. When used, the words “could,” “believe,” “anticipate,” “intend,” “estimate,” “expect,” “project” and similar expressions are intended to identify forward‑looking statements, although not all forward‑looking statements contain such identifying words. These forward‑looking statements are based on our current expectations and assumptions about future events and are based on currently available information as to the outcome and timing of future events. When considering forward-looking statements, you should keep in mind the risk factors and other cautionary statements described under the heading “Item 1A. Risk Factors” in this Annual Report on Form 10‑K. These forward‑looking statements are based on management’s current belief, based on currently available information, as to the outcome and timing of future events.
Forward‑looking statements may include statements about our:
|
·
| |
financial strategy, liquidity and capital required for our development program; |
|
·
| |
natural gas, natural gas liquids (“NGLs”), and oil prices; |
|
·
| |
timing and amount of future production of natural gas, NGLs, and oil; |
|
·
| |
hedging strategy and results; |
|
·
| |
ability to meet our minimum volume commitments and to utilize or monetize our firm transportation commitments; |
|
·
| |
competition and government regulations; |
|
·
| |
pending legal or environmental matters; |
|
·
| |
marketing of natural gas, NGLs, and oil; |
|
·
| |
leasehold or business acquisitions; |
|
·
| |
costs of developing our properties; |
|
·
| |
operations of Antero Midstream Partners LP; |
|
·
| |
general economic conditions; |
|
·
| |
uncertainty regarding our future operating results; and |
|
·
| |
plans, objectives, expectations and intentions. |
We caution you that these forward‑looking statements are subject to all of the risks and uncertainties, most of which are difficult to predict and many of which are beyond our control, incident to the exploration for and development, production, gathering, processing, transportation, and sale of natural gas, NGLs, and oil. These risks include, but are not limited to, commodity price volatility and continued low commodity prices, inflation, lack of availability of drilling and production equipment and services, environmental risks, drilling and other operating risks, marketing and transportation risks, regulatory changes, the uncertainty inherent in estimating natural gas, NGLs, and oil reserves and in projecting future rates of production, cash flow and access to capital, the timing of development expenditures, and the other risks described under the heading “Item 1A. Risk Factors” in this Annual Report on Form 10‑K.
Reserve engineering is a process of estimating underground accumulations of natural gas, NGLs, and oil that cannot be measured in an exact way. The accuracy of any reserve estimate depends on the quality of available data, the interpretation of such data and price and cost assumptions made by reservoir engineers. In addition, the results of drilling, testing and production activities, or changes in commodity prices, may justify revisions of estimates that were made previously. If significant, such revisions would
change the schedule of any further production and development drilling. Accordingly, reserve estimates may differ significantly from the quantities of natural gas, NGLs, and oil that are ultimately recovered.
Should one or more of the risks or uncertainties described in this report occur, or should underlying assumptions prove incorrect, our actual results and plans could differ materially from those expressed in any forward‑looking statements.
All forward‑looking statements, expressed or implied, included in this report are expressly qualified in their entirety by this cautionary statement. This cautionary statement should also be considered in connection with any subsequent written or oral forward‑looking statements that we or persons acting on our behalf may issue.
Except as otherwise required by applicable law, we disclaim any duty to update any forward‑looking statements, all of which are expressly qualified by the statements in this section, to reflect events or circumstances after the date of this Annual Report on Form 10‑K.
GLOSSARY OF OIL AND NATURAL GAS TERMS
The following are abbreviations and definitions of certain terms used in this document, which are commonly used in the oil and gas industry:
“100% success rate.” Antero defines the term “100% success rate” to mean that all wells were completed and produce in commercially viable quantities.
“Basin.” A large natural depression on the earth’s surface in which sediments, generally brought by water, accumulate.
“Bbl.” One stock tank barrel, of 42 U.S. gallons liquid volume, used herein in reference to crude oil, condensate, NGLs, or water.
“Bcf.” One billion cubic feet of natural gas.
“Bcfe.” One billion cubic feet of natural gas equivalent with one barrel of oil, condensate or NGLs converted to six thousand cubic feet of natural gas.
“Btu.” British thermal unit.
“Completion.” The process of treating a drilled well followed by the installation of permanent equipment for the production of natural gas or oil, or in the case of a dry hole, the reporting of abandonment to the appropriate agency.
“DD&A.” Depletion, depreciation, and amortization.
“Delineation.” The process of placing a number of wells in various parts of a reservoir to determine its boundaries and production characteristics.
“Developed acreage.” The number of acres that are allocated or assignable to productive wells or wells capable of production.
“Development well.” A well drilled within the proved area of an oil or natural gas reservoir to the depth of a stratigraphic horizon known to be productive.
“Dry hole.” A well found to be incapable of producing hydrocarbons in sufficient quantities such that proceeds from the sale of such production exceed production expenses and taxes.
“Exploratory well.” A well drilled to find and produce natural gas or oil reserves not classified as proved, to find a new reservoir in a field previously found to be productive of natural gas or oil in another reservoir or to extend a known reservoir.
“Field.” An area consisting of a single reservoir or multiple reservoirs all grouped on, or related to, the same individual geological structural feature or stratigraphic condition. The field name refers to the surface area, although it may refer to both the surface and the underground productive formations.
“Formation.” A layer of rock which has distinct characteristics that differs from nearby rock.
“Gross acres or gross wells.” The total acres or wells, as the case may be, in which a working interest is owned.
“Horizontal drilling.” A drilling technique used in certain formations where a well is drilled vertically to a certain depth and then drilled at a right angle within a specified interval.
“MBbl.” One thousand barrels of crude oil, condensate or NGLs.
“Mcf.” One thousand cubic feet of natural gas.
“MMBbl.” One million barrels of crude oil, condensate or NGLs.
“MMBtu.” One million British thermal units.
“MMcf.” One million cubic feet of natural gas.
“MMcf/d” MMcf per day.
“MMcfe.” One million cubic feet of natural gas equivalent with one barrel of oil, condensate or NGLs converted to six thousand cubic feet of natural gas.
“MMcfe/d.” MMcfe per day.
“NGLs.” Natural gas liquids. Hydrocarbons found in natural gas which may be extracted as liquefied petroleum gas and natural gasoline.
“NYMEX.” The New York Mercantile Exchange.
“Net acres.” The percentage of total acres an owner has out of a particular number of acres, or a specified tract. An owner who has 50% working interest in 100 acres owns 50 net acres.
“Net well.” The percentage ownership interest in a well that an owner has based on the working interest. An owner who has a 50% working interest has a 0.50 net well.
“Potential well locations.” Total gross locations that we may be able to drill on our existing acreage. Actual drilling activities may change depending on the availability of capital, regulatory approvals, seasonal restrictions, natural gas and oil prices, costs, drilling results and other factors.
“Productive well.” A well that is found to be capable of producing hydrocarbons in sufficient quantities such that proceeds from the sale of the production exceed production expenses and taxes.
“Prospect.” A specific geographic area which, based on supporting geological, geophysical or other data and also preliminary economic analysis using reasonably anticipated prices and costs, is deemed to have potential for the discovery of commercial hydrocarbons.
“Proved developed reserves.” Reserves that can be expected to be recovered through existing wells with existing equipment and operating methods.
“Proved reserves.” The estimated quantities of oil, natural gas and natural gas liquids which geological and engineering data demonstrate with reasonable certainty to be commercially recoverable in future years from known reservoirs under existing economic and operating conditions.
“Proved undeveloped reserves (“PUD”).” Proved reserves that are expected to be recovered from new wells on undrilled acreage or from existing wells where a relatively major expenditure is required for recompletion.
“PV‑10.” When used with respect to natural gas and oil reserves, PV‑10 means the estimated future gross revenue to be generated from the production of proved reserves, net of estimated production, future development and abandonment costs, using average yearly prices computed using SEC rules, before income taxes, and without giving effect to non‑property‑related expenses, discounted to a present value using an annual discount rate of 10% in accordance with the guidelines of the SEC. PV‑10 is not a financial measure calculated in accordance with generally accepted accounting principles (“GAAP”) and generally differs from Standardized Measure, the most directly comparable GAAP financial measure, because it does not include the effects of income taxes on future net revenues. Neither PV‑10 nor Standardized Measure represents an estimate of the fair market value of our natural gas and oil properties. We and others in the industry use PV‑10 as a measure to compare the relative size and value of proved reserves held by companies without regard to the specific tax characteristics of such entities.
“Recompletion.” The process of re‑entering an existing wellbore that is either producing or not producing and completing new reservoirs in an attempt to establish or increase existing production.
“Reservoir.” A porous and permeable underground formation containing a natural accumulation of producible oil and/or natural gas that is confined by impermeable rock or water barriers and is separate from other reservoirs.
“Spacing.” The distance between wells producing from the same reservoir. Spacing is often expressed in terms of acres, e.g., 40‑acre spacing, or distance between two horizontal well legs, and is often established by regulatory agencies.
“Standardized measure.” Discounted future net cash flows estimated by applying year‑end prices to the estimated future production of year‑end proved reserves. Future cash inflows are reduced by estimated future production and development costs based on period‑end costs to determine pre‑tax cash inflows. Future income taxes, if applicable, are computed by applying the statutory tax rate to the excess of pre‑tax cash inflows over our tax basis in the natural gas and oil properties. Future net cash inflows after income taxes are discounted using a 10% annual discount rate.
“Undeveloped acreage.” Lease acreage on which wells have not been drilled or completed to a point that would permit the production of commercial quantities of natural gas, NGLs, and oil regardless of whether such acreage contains proved reserves.
“Unit.” The joining of all or substantially all interests in a reservoir or field, rather than a single tract, to provide for development and operation without regard to separate property interests. Also, the area covered by a unitization agreement.
“Working interest.” The right granted to the lessee of a property to explore for and to produce and own natural gas or other minerals. The working interest owners bear the exploration, development, and operating costs on either a cash, penalty, or carried basis.
“WTI.” West Texas Intermediate light sweet crude oil.
PART I
Items 1 and 2. Business and Properties
Our Company
Antero Resources Corporation (“Antero”) is an independent oil and natural gas company engaged in the exploration, development, and acquisition of natural gas, NGLs, and oil properties located in the Appalachian Basin. We focus on unconventional reservoirs, which can generally be characterized as fractured shale formations. As of December 31, 2015, we held approximately 569,000 net acres of oil and gas properties located in the Appalachian Basin in West Virginia, Ohio, and Pennsylvania. Our corporate headquarters are in Denver, Colorado.
The following table provides a summary of selected data for our Appalachian Basin natural gas, NGLs, and oil assets as of the date and for the period indicated.
|
|
|
|
|
|
|
|
|
|
|
|
|
|
|
|
|
|
|
|
|
|
|
|
At December 31, 2015
|
|
Three months ended December 31, 2015
|
|
|
|
|
Proved Reserves (Bcfe)(1)
|
|
PV-10 (in millions)(2)
|
|
Net proved developed wells(3)
|
|
Total net acres(4)
|
|
Gross potential drilling locations(5)
|
|
Average net daily production (MMcfe/d)
|
|
|
Appalachian Basin:
|
|
|
|
|
|
|
|
|
|
|
|
|
|
|
|
|
|
|
|
|
Marcellus Shale
|
|
|
11,399
|
|
$
|
2,745
|
|
|
435
|
|
|
422,000
|
|
|
2,905
|
|
|
1,051
|
|
|
Upper Devonian
|
|
|
7
|
|
$
|
4
|
|
|
2
|
|
|
—
|
|
|
—
|
|
|
—
|
|
|
Deep Utica Shale rights
|
|
|
—
|
|
|
—
|
|
|
—
|
|
|
—
|
|
|
—
|
|
|
—
|
|
|
Ohio Utica Shale
|
|
|
1,809
|
|
$
|
885
|
|
|
110
|
|
|
147,000
|
|
|
814
|
|
|
446
|
|
|
Total
|
|
|
13,215
|
|
$
|
3,634
|
|
|
547
|
|
|
569,000
|
|
|
3,719
|
|
|
1,497
|
|
|
(1)
| |
Estimated proved reserve volumes and values were calculated assuming recovery of approximately 11,500 gross barrels of ethane per day, with rejection of the remaining ethane, and using the unweighted twelve‑month average of the first‑day‑of‑the‑month prices for the period ended December 31, 2015, which were $2.56 per MMBtu for natural gas, $14.19 per Bbl for NGLs and $40.06 per Bbl for oil for the Appalachian Basin based on a $50.13 WTI reference price. |
|
(2)
| |
PV‑10 is a non‑GAAP financial measure. For a reconciliation of PV‑10 to standardized measure, please see “—Our Properties and Operations—Estimated Proved Reserves.” |
|
(3)
| |
Does not include certain vertical wells that were primarily acquired in conjunction with leasehold acreage acquisitions. |
|
(4)
| |
Net acres allocable to the Upper Devonian and the deep Utica Shale rights are included in the net acres allocated to the Marcellus Shale because these multi‑horizon shale formations are generally attributable to the same leases. |
|
(5)
| |
See “Item 1A. Risk Factors” for risks and uncertainties related to developing our potential well locations. |
Our management team has worked together for many years and has a successful track record of reserve and production growth as well as significant expertise in unconventional resource plays. Our strategy is to leverage our team’s experience delineating and developing natural gas resource plays to profitably grow our reserves and production, primarily on our existing multi‑year project inventory.
We have assembled a portfolio of long‑lived properties that are characterized by what we believe to be low geologic risk and repeatability. Our drilling opportunities are focused in the Marcellus Shale and Utica Shale of the Appalachian Basin. From 2008 through December 31, 2015, our drilling operations in the Appalachian Basin have had a 100% success rate. We have approximately 3,719 potential horizontal well locations on our existing leasehold acreage, both proven and unproven.
We have secured sufficient long‑term firm takeaway capacity on major pipelines that are in existence or currently under construction in each of our core operating areas to accommodate our current development plans.
We operate in the following industry segments: (i) the exploration, development, and production of natural gas, NGLs, and oil, (ii) gathering and compression, (iii) water handling and treatment, and (iv) marketing of excess firm transportation capacity. All of our operations are conducted in the United States. Financial information for our industry segment operations is located under “Note 15: Segment Information.”
2015 Developments and Highlights
Energy Industry Environment
In late 2014, global energy commodity prices declined precipitously as a result of several factors, including an increase in worldwide commodity supplies, a stronger U.S. dollar, relatively mild weather in large portions of the U.S. during winter months, and strong competition among oil producing countries for market share. These events continued into 2015 and early 2016 and, along with slower economic growth in China, have led to the further suppression of commodity prices. Spot prices for WTI declined from approximately $106.00 per Bbl in June 2014 to less than $50.00 per Bbl in January 2015, and declined further to less than $30.00 per Bbl in January 2016. Spot prices for Henry Hub natural gas declined from approximately $4.40 per MMBtu in January 2014 to $3.00 per MMBtu in January 2015, and declined further to less than $1.80 per MMBtu for a brief period in December 2015. Spot prices for propane, which is the largest source of our NGLs sales revenue, declined from approximately $1.55 per gallon in January 2014 to less than $0.50 per gallon in January 2015, and declined further to less than $0.35 per gallon in January 2016.
In response to these market conditions and concerns about access to capital markets, many U.S. exploration and development companies significantly reduced their capital spending in 2015. Our capital spending for drilling, completions, and land for 2015 was $1.8 billion, a 44% reduction from our 2014 capital expenditures. In conjunction with the reduction in our capital expenditures during 2015, we deferred the completion of 50 wells.
Our capital budget for drilling, completions, and land for 2016 is $1.4 billion (excluding the capital budget for our consolidated subsidiary, Antero Midstream LP, or “Antero Midstream”), a 24% reduction from our 2015 capital expenditures. We plan to operate an average of 7 drilling rigs in 2016 as compared to an average of 14 rigs in 2015, and we plan to complete 115 horizontal wells in the Marcellus and Utica Shales in 2016 as compared to 130 in 2015. We believe that our 2016 capital budget will be fully funded through operating cash flow and available borrowing capacity under our revolving credit facility or capital market transactions. We will continue to monitor commodity prices and may revise the capital budget if conditions warrant. Additionally, given the current commodity price environment, we have evaluated the carrying value of our proved properties. See “Item 7. Management’s Discussion and Analysis of Financial Condition and Results of Operations—Critical Accounting Policies and Estimates” for a discussion of such evaluation.
Reserves, Production, and Financial Results
As of December 31, 2015, our estimated proved reserves were 13.2 Tcfe, consisting of 9.5 Tcf of natural gas, 587 MMBbl of NGLs and 26 MMBbl of oil. As of December 31, 2015, 72% of our estimated proved reserves by volume were natural gas, 27% were NGLs, and 1% was oil. Proved developed reserves were 5.8 Tcfe, or 44% of total proved reserves.
For the year ended December 31, 2015, our production totaled 545 Bcfe, or 1,493 MMcfe per day, a 48% increase over 2014 levels. The average price received for 2015 production before the effects of gains on settled derivatives was $2.52 per Mcfe compared to $4.73 in 2014. The decrease was primarily attributable to decreases in energy commodity prices that began in 2014 and continued into 2015. The average realized price after the effects of gains on settled derivatives was $4.10 per Mcfe for 2015 as compared to $5.10 per Mcfe for 2014.
For the year ended December 31, 2015, we generated cash flow from operations of $1.01 billion, net income of $941 million, and Adjusted EBITDAX of $1.22 billion. Net income in 2015 included (i) gains on unsettled derivatives of $1.52 billion (ii) a noncash charge of $98 million for equity-based compensation, (iii) a noncash charge of $104 million for impairments of unproved properties, and (iv) a noncash tax expense of $576 million. See “Item 6. Selected Financial Data” for a definition of Adjusted EBITDAX (a non‑GAAP measure) and a reconciliation of Adjusted EBITDAX to net income (loss).
Dropdown of Water Handling and Treatment Assets
On September 23, 2015, we contributed (i) all of the outstanding limited liability company interests of Antero Water LLC (“Antero Water”) to Antero Midstream and (ii) all of the assets, contracts, rights, permits and properties owned or leased by us and
used primarily in connection with the construction, ownership, operation, use or maintenance of our advanced wastewater treatment complex to be constructed in Doddridge County, West Virginia, to Antero Treatment LLC (“Antero Treatment”), a wholly-owned subsidiary of Antero Midstream (collectively, (i) and (ii) are referred to herein as the “Contributed Assets”).
In consideration for the Contributed Assets, Antero Midstream (i) paid us a cash distribution equal to $552.5 million, less $171 million of assumed debt, (ii) issued to us 10,988,421 common units representing limited partner interests in Antero Midstream, (iii) distributed to us proceeds of approximately $241 million from a private placement of Antero Midstream common units, and (iv) has agreed to pay us (a) $125 million in cash if Antero Midstream delivers 176,295,000 barrels or more of fresh water during the period between January 1, 2017 and December 31, 2019 and (b) an additional $125 million in cash if Antero Midstream delivers 219,200,000 barrels or more of fresh water during the period between January 1, 2018 and December 31, 2020. Antero Midstream borrowed $525 million on its bank credit facility in connection with this transaction.
2015 Capital Spending and 2016 Capital Budget
For the year ended December 31, 2015, our total capital expenditures were approximately $2.3 billion, including drilling and completion costs of $1.7 billion, gathering and compression project costs by Antero Midstream of $360 million, water handling and treatment costs of $131 million (a portion of which were expenditures by Antero Midstream), $199 million of leasehold costs, and other capital expenditures of $7 million. Our capital budget for drilling, completions, and land for 2016 is $1.4 billion, excluding the capital budget for Antero Midstream, and includes: $1.3 billion for drilling and completion and $100 million for core leasehold acreage acquisitions. We do not budget for acquisitions. Approximately 75% of the drilling and completion budget is allocated to the Marcellus Shale and the remaining 25% is allocated to the Utica Shale. During 2016, we plan to operate an average of 5 drilling rigs in the Marcellus Shale and 2 drilling rigs in the Utica Shale. Additionally, the capital budget for Antero Midstream for 2016 is approximately $435 million. We periodically review our capital expenditures and adjust our budget and its allocation based on liquidity, drilling results, leasehold acquisition opportunities, and commodity prices.
Hedge Position
At December 31, 2015, we had entered into fixed price hedging contracts for January 1, 2016 through December 31, 2022 for 3.365 Tcf of our projected natural gas production at a weighted average index price of $3.80 per MMBtu and 1.036 billion gallons of propane at a weighted average price of $0.51 per gallon. These hedging contracts include contracts for the year ending December 31, 2016 of 590.2 Bcf of natural gas at a weighted average index price of $3.92 per MMBtu and 461.2 million gallons of propane at a weighted average price of $0.59 per gallon. We believe this hedge position provides protection to cash flows supporting our future operations and capital spending plans for 2016 through 2022. As of December 31, 2015, the estimated fair value of our commodity derivative contracts was approximately $3.1 billion.
Credit Facilities
The current borrowing base under our revolving credit facility is $4.5 billion and lender commitments are $4.0 billion. The borrowing base under our revolving credit facility is redetermined semi‑annually and is based on the estimated future cash flows from our proved reserves and our commodity hedge positions. The next redetermination is scheduled to occur in April 2016. At December 31, 2015, we had $707 million of borrowings and $702 million of letters of credit outstanding under the revolving credit facility. Our revolving credit facility matures in May 2019. See “Item 7. Management’s Discussion and Analysis of Financial Condition and Results of Operations—Debt Agreements and Contractual Obligations—Senior Secured Revolving Credit Facility” for a description of our revolving credit facility.
Our consolidated subsidiary, Antero Midstream, has a revolving credit facility agreement that provides for lender commitments of $1.5 billion. At December 31, 2015, Antero Midstream had $620 million of borrowings outstanding under its revolving credit facility. The facility will mature in November 2019. See “Item 7. Management’s Discussion and Analysis of Financial Condition and Results of Operations—Debt Agreements and Contractual Obligations—Midstream Credit Facility” for a description of this revolving credit facility.
Issuance of 5.625% Senior Notes due 2022
On March 17, 2015, we issued $750 million of 5.625% senior notes due June 1, 2023 at par. The proceeds from the issuance were used to pay down amounts outstanding under our revolving credit facility.
As of December 31, 2015, we had four series of senior notes outstanding totaling $3.375 billion in aggregate principal amount. The notes bear interest at rates ranging from 5.125% to 6.00% and have maturity dates ranging from December 1, 2020 to June 1, 2023.
Issuance of Common Stock
On March 10, 2015, we completed an offering of 13,100,000 shares of our common stock. In connection with the offering, we granted the underwriter a 30-day option to purchase a maximum of 1,900,000 additional shares of our common stock at the offering price. On March 31, 2015, the underwriter exercised its option and purchased 1,600,000 shares. After deducting underwriting discounts and other expenses related to the offering, we received total net proceeds of approximately $538 million. The proceeds from the offering were used to pay down amounts outstanding under our revolving credit facility.
Our Properties and Operations
Estimated Proved Reserves
The information with respect to our estimated proved reserves presented below has been prepared in accordance with the rules and regulations of the SEC.
Reserves Presentation
The following table summarizes our estimated proved reserves, related standardized measure, and PV‑10 at December 31, 2013, 2014 and 2015. Our estimated proved reserves are based on evaluations prepared by our internal reserve engineers, which have been audited by our independent engineers, DeGolyer and MacNaughton (“D&M”). We refer to D&M as our independent engineers. A copy of the summary report of D&M with respect to our reserves at December 31, 2015 is filed as Exhibit 99.1 to this Annual Report on Form 10‑K. Within D&M, the technical person primarily responsible for reviewing our reserves estimates was Gregory K. Graves, P.E. Mr. Graves is a Registered Professional Engineer in the State of Texas (License No. 70734), is a member of both the Society of Petroleum Engineers and the Society of Petroleum Evaluation Engineers, and has in excess of 31 years of experience in oil and gas reservoir studies and reserves evaluations. Mr. Graves graduated from the University of Texas at Austin in 1984 with a Bachelor of Science degree in Petroleum Engineering. Reserves at December 31, 2013 and 2014 were prepared assuming ethane rejection. Reserves at December 31, 2015 were prepared assuming recovery of approximately 11,500 gross barrels of ethane per day, and rejection of the remaining ethane. When ethane is rejected at the processing plant, it is left in the gas stream and sold with the methane gas.
|
|
|
|
|
|
|
|
|
|
|
|
|
|
|
At December 31,
|
|
|
|
|
2013
|
|
2014
|
|
2015
|
|
|
Estimated proved reserves:
|
|
|
|
|
|
|
|
|
|
|
|
Proved developed reserves:
|
|
|
|
|
|
|
|
|
|
|
|
Natural gas (Bcf)
|
|
|
1,818
|
|
|
3,285
|
|
|
3,627
|
|
|
NGLs (MMBbl)
|
|
|
33
|
|
|
80
|
|
|
360
|
|
|
Oil (MMBbl)
|
|
|
2
|
|
|
6
|
|
|
8
|
|
|
Total equivalent proved developed reserves (Bcfe)
|
|
|
2,022
|
|
|
3,803
|
|
|
5,838
|
|
|
Proved undeveloped reserves:
|
|
|
|
|
|
|
|
|
|
|
|
Natural gas (Bcf)
|
|
|
4,936
|
|
|
7,250
|
|
|
5,906
|
|
|
NGLs (MMBbl)
|
|
|
105
|
|
|
250
|
|
|
227
|
|
|
Oil (MMBbl)
|
|
|
8
|
|
|
22
|
|
|
18
|
|
|
Total equivalent proved undeveloped reserves (Bcfe)
|
|
|
5,610
|
|
|
8,880
|
|
|
7,377
|
|
|
Total estimated proved reserves (Bcfe)
|
|
|
7,632
|
|
|
12,683
|
|
|
13,215
|
|
|
Proved developed producing (Bcfe)
|
|
|
1,771
|
|
|
3,508
|
|
|
5,553
|
|
|
Proved developed non-producing (Bcfe)
|
|
|
251
|
|
|
295
|
|
|
285
|
|
|
Percent developed
|
|
|
27
|
%
|
|
30
|
%
|
|
44
|
%
|
|
PV-10 (in millions)(1)
|
|
$
|
5,998
|
|
$
|
11,320
|
|
$
|
3,634
|
|
|
Standardized measure (in millions)(1)
|
|
$
|
4,510
|
|
$
|
7,635
|
|
$
|
3,233
|
|
|
(1)
| |
Pre-tax PV‑10 was prepared using average yearly prices computed using SEC rules, discounted at 10% per annum, without giving effect to taxes. Pre-tax PV‑10 is a non‑GAAP financial measure. We believe that the presentation of pre-tax PV‑10 is relevant and useful to our investors as supplemental disclosure to the standardized measure of future net cash flows, or after tax amount, |
because it presents the discounted future net cash flows attributable to our proved reserves prior to taking into account future corporate income taxes and our current tax structure. While the standardized measure is dependent on the unique tax situation of each company, pre-tax PV‑10 is based on a pricing methodology and discount factors that are consistent for all companies. Because of this, pre-tax PV‑10 can be used within the industry and by creditors and securities analysts to evaluate estimated net cash flows from proved reserves on a more comparable basis. The difference between the standardized measure and the pre-tax PV‑10 amount is the discounted amount of estimated future income taxes. For more information about the calculation of standardized measure, see footnote 18 to our consolidated financial statements included in Item 8 of this Annual Report on Form 10‑K. |
The following sets forth the estimated future net cash flows from our proved reserves (without giving effect to our commodity hedges), the present value of those net cash flows before income tax (PV‑10), the present value of those net cash flows after income tax (standardized measure) and the prices used in projecting future net cash flows at December 31, 2013, 2014, and 2015:
|
|
|
|
|
|
|
|
|
|
|
|
|
|
|
At December 31,
|
|
|
(In millions, except per Mcf data)
|
|
2013(1)
|
|
2014(2)
|
|
2015(3)
|
|
|
Future net cash flows
|
|
$
|
18,797
|
|
$
|
33,698
|
|
$
|
12,569
|
|
|
Present value of future net cash flows:
|
|
|
|
|
|
|
|
|
|
|
|
Before income tax (PV-10)
|
|
$
|
5,998
|
|
$
|
11,320
|
|
$
|
3,634
|
|
|
Income taxes
|
|
$
|
(1,488)
|
|
$
|
(3,685)
|
|
$
|
(401)
|
|
|
After income tax (Standardization measure)
|
|
$
|
4,510
|
|
$
|
7,635
|
|
$
|
3,233
|
|
|
(1)
| |
12‑month average prices used at December 31, 2013 were $3.65 per MMBtu for natural gas, $47.13 per Bbl for NGLs, and $87.00 per Bbl for oil for the Appalachian Basin based on a $97.17 WTI reference price. |
|
(2)
| |
12‑month average prices used at December 31, 2014 were $4.07 per MMBtu for natural gas, $45.89 per Bbl for NGLs, and $81.48 per Bbl for oil for the Appalachian Basin based on a $94.42 WTI reference price. |
|
(3)
| |
12‑month average prices used at December 31, 2015 were $2.56 per MMBtu for natural gas, $14.19 per Bbl for NGLs, and $40.06 per Bbl for oil for the Appalachian Basin based on a $50.13 WTI reference price. |
Future net cash flows represent projected revenues from the sale of proved reserves net of production and development costs (including operating expenses and production taxes). Prices for 2013, 2014 and 2015 were based on 12‑month unweighted average of the first‑day‑of‑the‑month pricing, without escalation. Costs are based on costs in effect for the applicable year without escalation. There can be no assurance that the proved reserves will be produced as estimated or that the prices and costs will remain constant. There are numerous uncertainties inherent in estimating reserves and related information, and different reservoir engineers often arrive at different estimates for the same properties.
Changes in Proved Reserves During 2015
The following table summarizes the changes in our estimated proved reserves during 2015 (in Bcfe):
|
|
|
|
|
|
Proved reserves, December 31, 2014
|
|
12,683
|
|
|
Extensions, discoveries, and other additions
|
|
2,878
|
|
|
Partial ethane recovery
|
|
1,091
|
|
|
Performance revisions
|
|
(358)
|
|
|
Revisions due to 5-year development rule
|
|
(2,332)
|
|
|
Price revisions
|
|
(202)
|
|
|
Production
|
|
(545)
|
|
|
Proved reserves, December 31, 2015
|
|
13,215
|
|
Extensions, discoveries, and other additions of 2,878 Bcfe resulted from delineation and development drilling in both the Marcellus and Utica Shales. Upward revisions of 1,091 Bcfe due to partial ethane recovery is a result of changing from ethane rejection at December 31, 2014 to partial ethane recovery in 2015. In 2015, we began ethane recovery and changed our underlying production assumptions to the recovery of approximately 11,500 gross barrels per day of ethane at December 31, 2015. Negative performance revisions of 358 Bcfe resulted from the revised statistical analysis of reserves based on actual production results. Negative revisions of 2,332 Bcfe were due to the SEC 5-year development rule because we no longer expect certain locations in the eastern portion of our Marcellus acreage containing primarily dry gas to be developed within five years. Negative revisions of 202
Bcfe were due to the decreases in prices for natural gas, NGLs, and oil. Our estimated proved reserves as of December 31, 2015 totaled approximately 13.2 Tcfe and increased by 4% over the prior year.
Proved Undeveloped Reserves
Proved undeveloped reserves are included in the previous table of total proved reserves. The following table summarizes the changes in our estimated proved undeveloped reserves during 2015 (in Bcfe):
|
|
|
|
|
|
Proved undeveloped reserves, December 31, 2014
|
|
8,880
|
|
|
Extension, discoveries, and other additions
|
|
2,355
|
|
|
Reclassifications to proved developed reserves
|
|
(986)
|
|
|
Performance revisions
|
|
(445)
|
|
|
Revisions due to 5-year development rule
|
|
(2,332)
|
|
|
Price revisions
|
|
(95)
|
|
|
Proved undeveloped reserves, December 31, 2015
|
|
7,377
|
|
Extensions, discoveries, and other additions during 2015 of 2,355 Bcfe of proved undeveloped reserves resulted from delineation and developmental drilling in the Marcellus and Utica Shales. Development drilling resulted in the reclassification of 986 Bcfe to proved developed reserves. Negative performance revisions of 445 Bcfe resulted from lower estimated ultimate recoveries from certain undeveloped wells. Negative revisions of 2,332 Bcfe were due to the SEC 5-year development rule because we no longer expect certain locations in the eastern portion of the Marcellus acreage containing primarily dry gas to be developed within five years. Negative revisions of 95 Bcfe were due to decreases in the prices for natural gas, NGLs, and oil. Proved undeveloped reserves include reserves that are expected to be drilled and developed within five years; wells that are not drilled within five years from booking are reclassified from proved reserves to probable reserves.
During the year ended December 31, 2015, we converted approximately 986 Bcfe of proved undeveloped reserves to proved developed reserves at a total capital cost of approximately $577 million. Estimated future development costs relating to the development of our proved undeveloped reserves at December 31, 2015 are approximately $5.1 billion over the next five years, which we expect to finance through cash flows from operations, borrowings under our revolving credit facility, and other sources of capital financing. Our drilling programs to date have focused on proving our unproved leasehold acreage through delineation drilling. While we will continue to drill leasehold delineation wells and build on our current leasehold position, we will also continue drilling our proved undeveloped reserves. All of our proved undeveloped reserves are expected to be developed over the next five years. See “Item 1A. Risk Factors—The development of our estimated proved undeveloped reserves may take longer and may require higher levels of capital expenditures than we currently anticipate. Therefore, our estimated proved undeveloped reserves may not be ultimately developed or produced.”
Preparation of Reserve Estimates
Our reserve estimates as of December 31, 2013, 2014, and 2015 included in this Annual Report on Form 10‑K were prepared by our internal reserve engineers in accordance with petroleum engineering and evaluation standards published by the Society of Petroleum Evaluation Engineers and definitions and guidelines established by the SEC. Our internally prepared reserve estimates were audited by our independent reserve engineers. Our independent reserve engineers were selected for their historical experience and geographic expertise in engineering unconventional resources. The technical persons responsible for overseeing the audit of our reserve estimates presented herein meet the requirements regarding qualifications, independence, objectivity and confidentiality set forth in the Standards Pertaining to the Estimating and Auditing of Oil and Gas Reserves Information promulgated by the Society of Petroleum Engineers.
Our internal staff of petroleum engineers and geoscience professionals work closely with our independent reserve engineers to ensure the integrity, accuracy and timeliness of data furnished to our independent reserve engineers in their reserve auditing process. Periodically, our technical team meets with the independent reserve engineers to review properties and discuss methods and assumptions used by us to prepare reserve estimates. Our internally prepared reserve estimates and related reports are reviewed and approved by our Senior Vice President of Reserves, Planning & Midstream, Ward D. McNeilly. Mr. McNeilly has been with the Company since October 2010. Mr. McNeilly has 35 years of experience in oil and gas operations, reservoir management, and strategic planning. From 2007 to October 2010, Mr. McNeilly was the Operations Manager for BHP Billiton’s Gulf of Mexico operations. From 1996 through 2007, Mr. McNeilly served in various North Sea and Gulf of Mexico Deepwater operations and asset management positions with Amoco and then BP. From 1979 through 1996, Mr. McNeilly served in various domestic and
international operations and reservoir and asset management positions with Amoco. Mr. McNeilly holds a B.S. in Geological Engineering from the Mackay School of Mines at the University of Nevada.
Our senior management also reviews our reserve estimates and related reports with Mr. McNeilly and other members of our technical staff. Additionally, our senior management reviews and approves any significant changes to our proved reserves on a quarterly basis.
Proved reserves are reserves which, by analysis of geoscience and engineering data, can be estimated with reasonable certainty to be economically producible from a given date forward from known reservoirs under existing economic conditions, operating methods and government regulations prior to the time at which contracts providing the right to operate expires, unless evidence indicates that renewal is reasonably certain. The term “reasonable certainty” implies a high degree of confidence that the quantities of oil or natural gas actually recovered will equal or exceed the estimate. To achieve reasonable certainty, we and the independent reserve engineers employed technologies that have been demonstrated to yield results with consistency and repeatability. The technologies and economic data used in the estimation of our proved reserves include, but are not limited to, well logs, geologic maps and available downhole and production data, micro‑seismic data, and well‑test data. Probable reserves are reserves that are less certain to be recovered than proved reserves but which, together with proved reserves, are as likely as not to be recovered. Estimates of probable reserves which may potentially be recoverable through additional drilling or recovery techniques are, by nature, more uncertain than estimates of proved reserves and, accordingly, are subject to substantially greater risk of realization. Possible reserves are reserves that are less certain to be recovered than probable reserves. Estimates of possible reserves are also inherently imprecise. Estimates of probable and possible reserves are also continually subject to revisions based on production history, results of additional exploration and development, price changes, and other factors.
Methodology Used to Apply Reserve Definitions
In the Marcellus Shale, our estimated reserves are based on information from our large, operated proved developed producing reserve base, as well as information from other operators in the area, which can be used to confirm or supplement our internal estimates. Typically, proved undeveloped properties are booked based on applying the estimated lateral length to the average Bcf per 1,000 feet from our proved developed producing wells.
We may attribute up to 11 proved undeveloped locations based on one proved developed producing well where analysis of geologic and engineering data can be estimated with reasonable certainty to be commercially recoverable. However, the ratio of proved undeveloped locations generated will be lower when multiple proved developed wells are drilled on a single pad. In addition, we have applied the concept of a statistical proven area to certain areas of our Marcellus Shale acreage whereby undeveloped properties are booked as proved reserves so long as well count is sufficient for statistical analysis and certain land, geologic, engineering and commercial criteria are met.
Although our operating history in the Utica Shale is more limited than our Marcellus Shale operations, we expect to be able to apply a similar methodology once the well count is sufficient for statistical analysis. The primary differences between the two areas are that (i) we have not established a statistical proven area in the Utica Shale and (ii) each proved developed producing well in the Utica Shale only generates four direct offset well locations in the Utica Shale due to less relative maturity.
Identification of Potential Well Locations
Our identified potential well locations include locations to which proved, probable or possible reserves were attributable based on SEC pricing as of December 31, 2015. We prepare internal estimates of probable and possible reserves but have not included disclosure of such reserves in this report.
Production, Revenues, and Price History
Because natural gas, NGLs, and oil are commodities, the price that we receive for our production is largely a function of market supply and demand. While demand for natural gas in the United States has increased materially since 2000, natural gas and NGLs supplies have also increased significantly as a result of horizontal drilling and fracture stimulation technologies which have been used to find and recover large amounts of oil and gas from various shale formations throughout the United States. Demand is impacted by general economic conditions, weather, and other seasonal conditions. Over or under supply of natural gas can result in substantial price volatility. Historically, commodity prices have been volatile, and we expect that volatility to continue in the future. The significant commodity price declines in late 2014 through 2015 and into 2016 are the most recent example of such volatility. A
substantial or extended decline in gas prices or poor drilling results could have a material adverse effect on our financial position, results of operations, cash flows, quantities of reserves that may be economically produced, and our ability to access capital markets. See “Item 1A. Risk Factors—Natural gas, NGLs, and oil prices are volatile. A substantial or extended decline in commodity prices may adversely affect our business, financial condition or results of operations and our ability to meet our capital expenditure obligations and financial commitments.”
Operations Data—Appalachian Basin
The following table sets forth information regarding our production, realized prices, and production costs in the Appalachian Basin for the years ended December 31, 2013, 2014 and 2015. For additional information on price calculations, see information set forth in “Item 7. Management’s Discussion and Analysis of Financial Condition and Results of Operations.”
|
|
|
|
|
|
|
|
|
|
|
|
|
|
|
Year ended December 31,
|
|
|
|
|
2013
|
|
2014
|
|
2015
|
|
|
Production data:
|
|
|
|
|
|
|
|
|
|
|
|
Natural gas (Bcf)
|
|
|
177
|
|
|
317
|
|
|
439
|
|
|
NGLs (MBbl)(1)
|
|
|
2,123
|
|
|
7,102
|
|
|
15,550
|
|
|
Oil (MBbl)
|
|
|
226
|
|
|
1,311
|
|
|
2,078
|
|
|
Combined (Bcfe)
|
|
|
191
|
|
|
368
|
|
|
545
|
|
|
Daily combined production (MMcfe/d)
|
|
|
522
|
|
|
1,007
|
|
|
1,493
|
|
|
Average prices before effects of derivative settlements:
|
|
|
|
|
|
|
|
|
|
|
|
Natural gas (per Mcf)
|
|
$
|
3.90
|
|
$
|
4.10
|
|
$
|
2.37
|
|
|
NGLs (per Bbl)(1)
|
|
$
|
52.61
|
|
$
|
46.23
|
|
$
|
17.01
|
|
|
Oil (per Bbl)
|
|
$
|
91.27
|
|
$
|
81.65
|
|
$
|
34.05
|
|
|
Combined average sales prices before effects of derivative settlements (per Mcfe)(2)
|
|
$
|
4.31
|
|
$
|
4.73
|
|
$
|
2.52
|
|
|
Combined average sales prices after effects of derivative settlements (per Mcfe)(2)
|
|
$
|
5.17
|
|
$
|
5.10
|
|
$
|
4.10
|
|
|
Average Costs (per Mcfe):
|
|
|
|
|
|
|
|
|
|
|
|
Lease operating
|
|
$
|
0.05
|
|
$
|
0.08
|
|
$
|
0.07
|
|
|
Gathering, compression, processing, and transportation
|
|
$
|
1.15
|
|
$
|
1.26
|
|
$
|
1.21
|
|
|
Production and ad valorem taxes
|
|
$
|
0.26
|
|
$
|
0.24
|
|
$
|
0.14
|
|
|
Depletion, depreciation, amortization, and accretion
|
|
$
|
1.23
|
|
$
|
1.30
|
|
$
|
1.31
|
|
|
General and administrative (before equity-based compensation)
|
|
$
|
0.32
|
|
$
|
0.28
|
|
$
|
0.25
|
|
|
(1)
| |
NGLs information for 2015 includes ethane production of approximately 201 MBbl at an average realized price of $6.17 per Bbl. |
|
(2)
| |
Average prices shown reflect both the before and after effects of our commodity hedging transactions. Our calculation of such effects includes gains or losses recognized on settlement of commodity derivatives, which do not qualify for hedge accounting because we do not designate them as hedges. |
Productive Wells
As of December 31, 2015, we had a total of 708 gross (666 net) producing wells, averaging a 94% working interest, in the Marcellus Shale. This well count includes 437 gross (426 net) horizontal wells, and 271 gross (239 net) vertical wells that were primarily acquired in conjunction with leasehold acreage acquisitions. In the Utica Shale, we had 111 gross (95 net) producing horizontal wells at December 31, 2015, averaging an 85% working interest. Our wells are gas wells, many of which also produce oil, condensate, and NGLs. Additionally, at December 31, 2015 we had 118 gross horizontal wells (115 net) waiting on completion or in the process of being completed.
Acreage
The following table sets forth certain information regarding the total developed and undeveloped acreage in which we owned an interest as of December 31, 2015. A majority of our developed acreage is subject to liens securing our revolving credit facility.
Approximately 52% of our Marcellus acreage and 28% of our Utica acreage is held by production. Acreage related to royalty, overriding royalty, and other similar interests is excluded from this table.
|
|
|
|
|
|
|
|
|
|
|
|
|
|
|
|
|
|
Developed Acres
|
|
Undeveloped Acres
|
|
Total Acres
|
|
|
Basin
|
|
Gross
|
|
Net
|
|
Gross
|
|
Net
|
|
Gross
|
|
Net
|
|
|
Marcellus Shale
|
|
69,782
|
|
68,532
|
|
515,914
|
|
353,467
|
|
585,696
|
|
421,999
|
|
|
Utica Shale
|
|
23,212
|
|
18,813
|
|
149,640
|
|
128,661
|
|
172,852
|
|
147,474
|
|
|
Other
|
|
—
|
|
—
|
|
6,609
|
|
6,599
|
|
6,609
|
|
6,599
|
|
|
Total
|
|
92,994
|
|
87,345
|
|
672,163
|
|
488,727
|
|
765,157
|
|
576,072
|
|
The following table provides a summary of our current gross and net acreage by county in the Marcellus Shale and the Ohio Utica Shale.
|
|
|
|
|
|
|
|
|
|
Marcellus
|
|
|
County
|
|
Gross
Acres
|
|
Net
Acres
|
|
|
Doddridge, WV
|
|
196,137
|
|
138,659
|
|
|
Gilmer, WV
|
|
15,683
|
|
10,916
|
|
|
Harrison, WV
|
|
117,616
|
|
99,979
|
|
|
Lewis, WV
|
|
89
|
|
65
|
|
|
Marion, WV
|
|
3,626
|
|
3,468
|
|
|
Monongalia, WV
|
|
1,649
|
|
1,455
|
|
|
Pleasants, WV
|
|
6,967
|
|
3,649
|
|
|
Ritchie, WV
|
|
92,401
|
|
69,070
|
|
|
Tyler, WV
|
|
107,423
|
|
63,514
|
|
|
Wetzel, WV
|
|
15,870
|
|
6,623
|
|
|
Fayette, PA
|
|
7,364
|
|
5,423
|
|
|
Greene, PA
|
|
954
|
|
454
|
|
|
Washington, PA
|
|
13,131
|
|
12,217
|
|
|
Westmoreland, PA
|
|
6,786
|
|
6,507
|
|
|
Total Marcellus Shale
|
|
585,696
|
|
421,999
|
|
|
|
|
|
|
|
|
|
|
|
Ohio Utica
|
|
|
|
|
Gross
Acres
|
|
Net
Acres
|
|
|
Athens, OH
|
|
84
|
|
84
|
|
|
Belmont, OH
|
|
15,354
|
|
14,618
|
|
|
Guernsey, OH
|
|
5,927
|
|
4,620
|
|
|
Harrison, OH
|
|
577
|
|
577
|
|
|
Monroe, OH
|
|
59,494
|
|
55,647
|
|
|
Noble, OH
|
|
88,349
|
|
69,497
|
|
|
Washington, OH
|
|
3,067
|
|
2,431
|
|
|
Total Utica Shale
|
|
172,852
|
|
147,474
|
|
|
|
|
|
|
|
|
|
Total Marcellus and Utica Shale
|
|
758,548
|
|
569,473
|
|
Undeveloped Acreage Expirations
The following table sets forth the number of total gross and net undeveloped acres as of December 31, 2015 that will expire over the next three years unless production is established within the spacing units covering the acreage prior to the expiration dates, or unless such acreage is extended or renewed.
|
|
|
|
|
|
|
|
|
|
|
|
|
|
|
|
|
|
Marcellus
|
|
Ohio Utica
|
|
Total
|
|
|
|
|
Gross
Acres
|
|
Net
Acres
|
|
Gross
Acres
|
|
Net
Acres
|
|
Gross
Acres
|
|
Net
Acres
|
|
|
2016
|
|
17,552
|
|
10,058
|
|
18,596
|
|
13,036
|
|
36,148
|
|
23,094
|
|
|
2017
|
|
62,127
|
|
38,234
|
|
51,660
|
|
42,212
|
|
113,787
|
|
80,446
|
|
|
2018
|
|
53,380
|
|
33,776
|
|
28,463
|
|
23,069
|
|
81,843
|
|
56,845
|
|
Drilling Activity
The following table sets forth the results of our drilling activity for wells drilled and completed during the years ended December 31, 2013, 2014, and 2015. Gross wells reflect the sum of all wells in which we own an interest and includes historical drilling activity in the Appalachian Basin. Net wells reflect the sum of our working interests in gross wells.
|
|
|
|
|
|
|
|
|
|
|
|
|
|
|
|
|
|
Year ended December 31,
|
|
|
|
|
2013
|
|
2014
|
|
2015
|
|
|
|
|
Gross
|
|
Net
|
|
Gross
|
|
Net
|
|
Gross
|
|
Net
|
|
|
Marcellus
|
|
|
|
|
|
|
|
|
|
|
|
|
|
|
Development wells:
|
|
|
|
|
|
|
|
|
|
|
|
|
|
|
Productive
|
|
49
|
|
48
|
|
77
|
|
76
|
|
69
|
|
68
|
|
|
Dry
|
|
—
|
|
—
|
|
—
|
|
—
|
|
—
|
|
—
|
|
|
Total development wells
|
|
49
|
|
48
|
|
77
|
|
76
|
|
69
|
|
68
|
|
|
Exploratory wells:
|
|
|
|
|
|
|
|
|
|
|
|
|
|
|
Productive
|
|
63
|
|
62
|
|
43
|
|
42
|
|
5
|
|
5
|
|
|
Dry
|
|
—
|
|
—
|
|
—
|
|
—
|
|
—
|
|
—
|
|
|
Total exploratory wells
|
|
63
|
|
62
|
|
43
|
|
42
|
|
5
|
|
5
|
|
|
|
|
|
|
|
|
|
|
|
|
|
|
|
|
|
Utica
|
|
|
|
|
|
|
|
|
|
|
|
|
|
|
Development wells:
|
|
|
|
|
|
|
|
|
|
|
|
|
|
|
Productive
|
|
3
|
|
3
|
|
11
|
|
10
|
|
21
|
|
18
|
|
|
Dry
|
|
—
|
|
—
|
|
—
|
|
—
|
|
—
|
|
—
|
|
|
Total development wells
|
|
3
|
|
3
|
|
11
|
|
10
|
|
21
|
|
18
|
|
|
Exploratory wells:
|
|
|
|
|
|
|
|
|
|
|
|
|
|
|
Productive
|
|
13
|
|
10
|
|
23
|
|
19
|
|
37
|
|
33
|
|
|
Dry
|
|
—
|
|
—
|
|
—
|
|
—
|
|
—
|
|
—
|
|
|
Total exploratory wells
|
|
13
|
|
10
|
|
23
|
|
19
|
|
37
|
|
33
|
|
|
|
|
|
|
|
|
|
|
|
|
|
|
|
|
|
Total
|
|
|
|
|
|
|
|
|
|
|
|
|
|
|
Development wells:
|
|
|
|
|
|
|
|
|
|
|
|
|
|
|
Productive
|
|
52
|
|
51
|
|
88
|
|
86
|
|
90
|
|
86
|
|
|
Dry
|
|
—
|
|
—
|
|
—
|
|
—
|
|
—
|
|
—
|
|
|
Total development wells
|
|
52
|
|
51
|
|
88
|
|
86
|
|
90
|
|
86
|
|
|
Exploratory wells:
|
|
|
|
|
|
|
|
|
|
|
|
|
|
|
Productive
|
|
76
|
|
72
|
|
66
|
|
61
|
|
42
|
|
38
|
|
|
Dry
|
|
—
|
|
—
|
|
—
|
|
—
|
|
—
|
|
—
|
|
|
Total exploratory wells
|
|
76
|
|
72
|
|
66
|
|
61
|
|
42
|
|
38
|
|
The figures in the table above do not include 118 gross wells (115 net) waiting on completion or in the process of being completed at December 31, 2015.
Delivery Commitments
We have entered into various firm sales contracts to deliver and sell gas. We believe we will have sufficient production quantities to meet substantially all of such commitments, but may be required to purchase gas from third parties to satisfy shortfalls should they occur.
As of December 31, 2015, our firm sales commitments through 2020 included:
|
|
|
|
|
|
|
|
|
|
Year Ending December 31,
|
|
Volume of Natural Gas (MMBtu/d)
|
|
Firm Transport Capacity Utilized (MMBtu/d)
|
|
Volume of Ethane (Bbl/day)
|
|
|
2016
|
|
1,010,000
|
|
890,000
|
|
2,900
|
|
|
2017
|
|
950,000
|
|
830,000
|
|
11,500
|
|
|
2018
|
|
1,130,000
|
|
1,010,000
|
|
11,500
|
|
|
2019
|
|
1,150,000
|
|
1,040,000
|
|
11,500
|
|
|
2020
|
|
1,060,000
|
|
1,020,000
|
|
11,500
|
|
As provided in the table above, we utilize a part of our firm transportation capacity to deliver gas and NGLs under the majority of these firm sales contracts. We have firm transportation contracts that require us to deliver products to pipeline transporters or pay demand charges for shortfalls. The minimum demand fees are reflected in our table of contractual obligations. See “Management’s Discussion and Analysis of Financial Condition and Results of Operations—Debt Agreements and Contractual Obligations.” If our production quantities are insufficient to meet such commitments, we may purchase third party products or market our excess firm transportation capacity to third parties.
Gathering and Compression
Our exploration and development activities are supported by the natural gas gathering and compression assets of our subsidiary, Antero Midstream, as well as by third‑party gathering, compression, processing, and transportation arrangements. Unlike many producing basins in the United States, certain portions of the Appalachian Basin do not have sufficient midstream infrastructure to support the existing and expected increasing levels of production. Our relationship with Antero Midstream allows us to obtain the necessary gathering and compression capacity for our production.
Prior to Antero Midstream’s initial public offering in November 2014 (the “IPO”), we committed to developing the necessary midstream infrastructure to support our drilling schedule and production growth. We accomplished this goal through a combination of internal asset developments and contractual relationships with third‑party midstream service providers.
As part of our internal developments, we invested a significant amount of capital in building low‑ and high‑pressure gathering lines, and compressor stations. Since its IPO in November 2014, we have leveraged our relationship with Antero Midstream to support our growth. In 2015, Antero Midstream spent approximately $320 million on midstream gas and condensate gathering and compression infrastructure that services our production.
As of December 31, 2015, Antero Midstream, owned and operated 182 miles of gas gathering pipelines in the Marcellus Shale. We also have access to additional low‑pressure and high‑pressure pipelines owned and operated by Crestwood, Energy Transfer Partners L.P., and Summit Midstream. As of December 31, 2015, Antero Midstream owned and operated 8 compressor stations and we utilized 14 additional third‑party compressor stations in the Marcellus Shale. The gathering, compression and dehydration services provided by third parties are contracted on a fixed‑fee basis.
As of December 31, 2015, Antero Midstream owned and operated 110 miles of low‑pressure, high‑pressure, and condensate pipelines in the Utica Shale, and Antero owned and operated 8 miles of high-pressure pipelines. As of December 31, 2015, Antero Midstream owned and operated 1 compressor station and we utilized 5 third‑party compressor stations in the Utica Shale.
Pursuant to our gathering and compression services agreement with Antero Midstream entered into in 2014, we dedicated substantially all of our current and future acreage for gathering and compression services for 20 years. All of our existing acreage is dedicated to Antero Midstream for gathering and compression services except for acreage attributable to third party commitments in effect prior to the Antero Midstream IPO, which includes 136,000 Marcellus Shale net leasehold acres characterized by dry gas and liquids rich reserves that have been previously dedicated to third party gatherers. In addition to our existing acreage dedication, the agreement provides that any acreage we acquire in the future will be dedicated to Antero Midstream for gathering and compression services unless such acreage is subject to a pre-existing dedication for such services. Antero Midstream also provides condensate gathering services to us under the gathering and compression agreement.
Natural Gas Processing
Many of our wells in the Marcellus and Utica Shales allow us to produce liquids rich natural gas that contains a significant amount of NGLs. Natural gas containing significant amounts of NGLs must be processed, which involves the removal and separation of NGLs from the wellhead natural gas.
NGLs are valuable commodities once removed from the natural gas stream and fractionated into their key components. Fractionation refers to the process by which a NGLs stream is separated into individual NGLs products such as ethane, propane, normal butane, isobutane, and natural gasoline. Fractionation occurs by heating the mixed NGL stream to allow for the separation of the component parts based on the specific boiling points of each product. Each of the individual products have their own market price.
The combination of infrastructure constraints in the Appalachian region and low ethane prices has resulted in many producers “rejecting” rather than “recovering” ethane. Ethane rejection occurs when ethane is left in the wellhead gas stream when the gas is processed, rather than being separated out and sold as a liquid after fractionation. When ethane is left in the gas stream, the Btu content of the residue gas at the tailgate of the processing plant is higher. Producers will elect to “reject” ethane when the price received for the ethane in the gas stream is greater than the net price received for the ethane being sold as a liquid after fractionation. When ethane is recovered, the Btu content of the residue gas is lower, but a producer is then able to recover the value of the ethane sold as a separate product.
Given the existing commodity price environment and the current limited ethane market in the northeast, we are currently rejecting most of the ethane when processing our liquids‑rich gas. However, we realize a pricing upgrade when selling the remaining NGL products stream at current prices. We may elect to recover more ethane when ethane prices result in a value for the ethane that is greater than the Btu equivalent residue gas and incremental recovery costs. In December 2015, we began recovering some ethane as the first de-ethanizer was placed on line at the Sherwood gas processing facility, and our first international ethane sales contract is expected to commence in 2017.
Through third‑party contractual relationships, we have obtained committed cryogenic processing capacity for our Marcellus and Utica Shale production. We have contracted with MarkWest Energy Partners L.P. to provide processing capacity as follows:
|
|
|
|
|
|
|
|
|
|
|
Plant Processing Capacity (MMcf/d)
|
|
Antero Contracted Firm Processing Capacity (MMcf/d)
|
|
Anticipated Date of Completion
|
|
Marcellus Shale:
|
|
|
|
|
|
|
|
Sherwood I
|
|
200
|
|
200
|
|
In service
|
|
Sherwood II
|
|
200
|
|
200
|
|
In service
|
|
Sherwood III
|
|
200
|
|
150
|
|
In service
|
|
Sherwood IV
|
|
200
|
|
200
|
|
In service
|
|
Sherwood V
|
|
200
|
|
200
|
|
In service
|
|
Sherwood VI
|
|
200
|
|
200
|
|
In service
|
|
Sherwood VII
|
|
200
|
|
200
|
|
2017
|
|
Marcellus Shale Total
|
|
1,400
|
|
1,350
|
|
|
|
|
|
|
|
|
|
|
|
Utica Shale:
|
|
|
|
|
|
|
|
Seneca I
|
|
200
|
|
150
|
|
In service
|
|
Seneca II
|
|
200
|
|
50
|
|
In service
|
|
Seneca III
|
|
200
|
|
200
|
|
In service
|
|
Seneca IV
|
|
200
|
|
200
|
|
In service
|
|
Utica Shale Total
|
|
800
|
|
600
|
|
|
Transportation and Takeaway Capacity
Our primary firm transportation commitments include the following:
|
·
| |
We have entered into firm transportation agreements with various pipelines that enable us to deliver natural gas to the Midwest, Gulf Coast, Eastern Regional, and Mid-Atlantic markets. |
|
·
| |
We have several firm transportation contracts with pipelines that have capacity to deliver natural gas to the Chicago and |
Michigan markets. The Chicago directed pipelines include the Rockies Express Pipeline (“REX”), the Midwestern Gas Transmission pipeline (“MGT”), the Natural Gas Pipeline Company of America pipeline (“NGPL”), and the ANR Pipeline Company pipeline (“ANR”). |
|
o
| |
The firm transportation contract on REX provides firm capacity for 600,000 MMBtu per day and will deliver gas to downstream contracts on MGT, NGPL, and ANR. We have 165,000 MMBtu per day of firm transportation on MGT which will increase by an additional 125,000 MMBtu per day in March 2016. We have 235,000 MMBtu per day of firm transportation on NGPL which will increase by an additional 75,000 MMBtu per day in November 2016. Both of these contracts will deliver gas to the Chicago city gate area.In addition, we have 200,000 MMBtu per day of firm transportation on ANR-Chicago to deliver natural gas to Chicago in the summer and Michigan in the winter. The contracts expire at various dates from 2021 through 2034. |
|
·
| |
To access the Gulf Coast market and Eastern Regional markets, we have firm transportation contracts with various pipelines. These contracts include firm capacity on the Columbia Gas Transmission pipeline (“TCO”), Columbia Gulf Transmission pipeline (“Columbia Gulf”), Tennessee Gas Pipeline Company pipeline (“Tennessee”), ANR Pipeline Company pipeline (“ANR-Gulf”), Equitrans pipeline (“EQT”), and the M3 Appalachian Gathering System (“M3”). This diverse portfolio of firm capacity gives us the flexibility to move natural gas to the local Appalachia market or other preferred markets, thereby allowing the company to diversify its exposure to indices with less favorable pricing. |
|
o
| |
We have several firm transportation contracts on TCO for volumes that total to approximately 582,000 MMBtu per day. Of the 582,000 MMBtu per day of firm capacity on TCO, we have the ability to utilize 530,000 MMbtu per day of firm capacity on Columbia Gulf, which provides access to the Gulf Coast markets. These contracts expire at various dates from 2017 through 2025. |
|
o
| |
We have a firm transportation contract with Stonewall Gas Gathering for 1,100,000 MMBtu per day which will transport gas from various gathering system interconnection points and the MarkWest Sherwood Plant complex to the TCO WB System. We have a firm transportation contract with TCO to transport natural gas in the western and eastern direction on TCO’s WB system. The firm transportation contract on TCO’s WB system provides firm capacity in the western direction for volumes that increase from 590,000 MMBtu per day to 790,000 MMBtu per day in June 2018. This west directed firm capacity provides access to the local Appalachia market and the Gulf Coast market via the Columbia Gulf or Tennessee pipelines. The firm transportation contract on TCO’s WB system also provides firm capacity in the eastern direction, which delivers natural gas to the Cove Point LNG facility, for 330,000 MMBtu per day beginning in June 2018. These contracts expire at various dates from 2030 through 2037. |
|
o
| |
We have a firm transportation contract for 600,000 MMBtu per day on ANR-Gulf to deliver natural gas from Ohio to the Gulf Coast market. This contract expires in 2045. |
|
o
| |
We have a firm transportation contract for 800,000 MMBtu per day, estimated to be in-service in mid 2017, on the Energy Transfer Rover Pipeline which will connect the Marcellus and Utica Shale assets to Midwest and Gulf Coast markets, or for export to Canadian markets, via our existing firm transportation on ANR Chicago and ANR Gulf. This contract expires in 2033. |
|
o
| |
We have firm transportation contracts for 250,000 MMBtu per day on EQT to deliver Marcellus natural gas to other various delivery points. The contracts expire at various dates from 2021 through 2025. |
|
o
| |
We have firm transportation contracts for 375,000 MMBtu per day on the M3 Appalachian Gathering System to deliver Marcellus natural gas to TETCO M2 and other various local delivery points. |
|
·
| |
We have a firm transportation contract for 20,000 Bbl per day on the Enterprise Products Partners ATEX pipeline (“ATEX”), to take ethane from Appalachia to Mont Belvieu, Texas. The ATEX firm transportation commitment expires in 2028. |
|
·
| |
We have a firm transportation contract for 11,500 Bbl per day on the Sunoco pipeline (or “Mariner East 2”) to take ethane from Houston, Pennsylvania to Marcus Hook, Pennsylvania. We also have a firm transportation contract on Mariner East 2 to take 50,000 Bbl per day of propane or butane from Hopedale, Ohio to Marcus Hook, Pennsylvania. |
The expected in-service date of Mariner East 2 is early 2017. These contracts expire on the tenth anniversary from the in-service date. The Mariner East 2 provides access to international markets via trans-ocean cargo carriers. |
Under firm transportation contracts, we are obligated to deliver minimum daily volumes or pay fees for any deficiencies in deliveries. See “Item 7. Management’s Discussion and Analysis of Financial Condition and Results of Operations—Debt Agreements and Contractual Obligations” for information on our minimum fees for such contracts. Based on current projected 2016 annual production levels, we estimate that we could incur total annual net marketing costs of $95 million to $125 million in 2016 for unutilized transportation capacity depending on the amount of unutilized capacity that can be marketed to third parties or utilized to transport third party gas and capture positive basis differentials. Where permitted, we continue to actively market any excess capacity in order to offset minimum commitment fees.
Water Handling and Treatment Operations
On September 23, 2015, we contributed (i) all of the outstanding limited liability company interests of Antero Water to Antero Midstream and (ii) all of the assets, contracts, rights, permits and properties owned or leased by us and used primarily in connection with the construction, ownership, operation, use or maintenance of our advanced wastewater treatment complex to be constructed in Doddridge County, West Virginia, to Antero Treatment, a wholly-owned subsidiary of Antero Midstream. Our relationship with Antero Midstream allows us to obtain the necessary fresh and recycled water for use in our drilling and completion operations, as well as services to dispose of waste water resulting from our operations.
Antero Midstream owns two independent fresh water distribution systems that distribute fresh water from the Ohio River and several regional water sources for well completion operations in the Marcellus and Utica Shales. These systems consist of permanent buried pipelines, movable surface pipelines and fresh water storage facilitates, as well as pumping stations to transport the fresh water throughout the pipeline networks. To the extent necessary, the surface pipelines are moved to well pads for service completion operations in concert with our drilling program. As of December 31, 2015, Antero Midstream had the ability to store a total of 4.9 million barrels of fresh water in 35 impoundments.
Due to the extensive geographic distribution of Antero Midstream’s water pipeline systems in both West Virginia and Ohio, it has provided water delivery services to neighboring oil and gas producers within and adjacent to our operating area, and is able to provide water delivery services to other oil and gas producers in the area, subject to commercial arrangements, in an effort to further reduce water truck traffic.
As of December 31, 2015, Antero Midstream owned and operated 104 miles of buried fresh water pipelines and 80 miles of movable surface fresh water pipelines in the Marcellus Shale, as well as 22 centralized water storage facilities equipped with transfer pumps. As of December 31, 2015, Antero Midstream owned and operated 49 miles of buried fresh water pipelines and 26 miles of movable surface fresh water pipelines in the Utica Shale, as well as 13 centralized water storage facilities equipped with transfer pumps.
In August 2015, we committed to developing an advanced wastewater treatment complex in Doddridge County, West Virginia. The complex was transferred to Antero Midstream in conjunction with the sale of our water handling systems. The wastewater treatment complex, once completed, will include a 60,000 barrel per day facility that will allow Antero Midstream to treat our flowback and produced water for subsequent use or sale for well completions. The treatment facility is expected to be in service near the end of 2017. Late in 2015, Antero Midstream began providing us with waste water services for our well completion operations, including waste water transportation, disposal, and treatment.
Major Customers
For the year ended December 31, 2015, three of our customers accounted for approximately 19%, 18%, and 13% of our total product revenues, respectively. For the year ended December 31, 2014, three of our customers accounted for 29%, 16%, and 12% of our total product revenues, respectively. For the year ended December 31, 2013, two of our customers accounted for 30% and 14% or our total product revenues, respectively. Although a substantial portion of our production is purchased by these major customers, we do not believe the loss of any one or several customers would have a material adverse effect on our business, as we believe other customers or markets would be accessible to us.
Title to Properties
We believe that we have satisfactory title to all of our producing properties in accordance with generally accepted industry standards. As is customary in the industry, often in the case of undeveloped properties, cursory investigation of record title is made at the time of lease acquisition. Investigations are made before the consummation of an acquisition of producing properties and before commencement of drilling operations on undeveloped properties. Individual properties may be subject to burdens that we believe do not materially interfere with the use, or affect the value of, the properties. Burdens on properties may include:
|
·
| |
customary royalty interests; |
|
·
| |
liens incident to operating agreements and for current taxes; |
|
·
| |
obligations or duties under applicable laws; |
|
·
| |
development obligations under natural gas leases; or |
Seasonality
Demand for natural gas generally decreases during the spring and fall months and increases during the summer and winter months. However, seasonal anomalies such as mild winters or mild summers sometimes lessen this fluctuation. Cold winters can significantly increase demand and price fluctuations. In addition, certain natural gas users utilize natural gas storage facilities and purchase some of their anticipated winter requirements during the summer. This can also reduce seasonal demand fluctuations. These seasonal anomalies can increase competition for equipment, supplies and personnel during the spring and summer months, which could lead to shortages and increase costs or delay our operations.
Competition
The oil and natural gas industry is intensely competitive, and we compete with other companies in our industry that have greater resources than we do. Many of these companies not only explore for and produce natural gas, but also carry on refining operations and market petroleum and other products on a regional, national or worldwide basis. These companies may be able to pay more for productive natural gas properties and exploratory prospects or define, evaluate, bid for, and purchase a greater number of properties and prospects than our financial or human resources permit, and may be able to expend greater resources to attract and maintain industry personnel. In addition, these companies may have a greater ability to continue exploration activities during periods of low natural gas market prices. Our larger competitors may be able to absorb the burden of existing, and any changes to, federal, state, and local laws and regulations more easily than we can, which would adversely affect our competitive position. Our ability to acquire additional properties and to discover reserves in the future will be dependent upon our ability to evaluate and select suitable properties and to consummate transactions in a highly competitive environment. In addition, because we have fewer financial and human resources than many companies in our industry, we may be at a disadvantage in bidding for exploratory prospects and producing natural gas properties.
Regulation of the Oil and Natural Gas Industry
General
Our oil and natural gas operations are subject to extensive, and frequently changing, laws and regulations related to the production, transportation and sale of oil, natural gas and NGLs. We believe compliance with existing requirements will not have a material adverse effect on our financial position, cash flows or results of operations. However, such laws and regulations are frequently amended or reinterpreted. Additional proposals and proceedings that affect the oil and natural gas industries are regularly considered by Congress, federal agencies, the states, local governments, and the courts. We cannot predict when or whether any such proposals may become effective. Therefore, we are unable to predict the future costs or impact of compliance. The regulatory burden on the industry increases the cost of doing business and affects profitability. We do not believe, however, that any regulatory changes will affect us in a way that materially differs from the way they will affect other natural gas producers, gatherers, and marketers with which we compete.
Regulation of Production of Natural Gas and Oil
We own interests in properties located onshore in three U.S. states, and our production activities on these properties are subject to regulation under a wide range of local, state and federal statutes, rules, orders and regulations. These statutes and regulations address requirements related to permits for drilling of wells, bonding to drill or operate wells, the location of wells, the method of drilling and casing wells, the surface use and restoration of properties upon which wells are drilled, sourcing and disposal of water used in the drilling and completion process, the plugging and abandonment of wells, venting or flaring of natural gas, and the ratability or fair apportionment of production from fields and individual wells. In addition, all of the states in which we own and operate properties have regulations governing environmental and conservation matters, including provisions for the handling and disposing or discharge of waste materials, the unitization or pooling of natural gas and oil properties, the establishment of maximum allowable rates of production from natural gas and oil wells, and the size of drilling and spacing units or proration units and the density of wells that may be drilled. Some states also have the power to prorate production to the market demand for oil and gas. The effect of these regulations is to limit the amount of natural gas and oil that we can produce from our wells and to limit the number of wells or the locations at which we can drill, although we can apply for exceptions to such regulations or to have reductions in well spacing or density. Moreover, each state generally imposes a production or severance tax with respect to the production and sale of oil, natural gas, and NGLs within its jurisdiction.
The failure to comply with these rules and regulations can result in substantial penalties. Our competitors in the oil and natural gas industry are subject to the same regulatory requirements and restrictions that affect our operations.
Regulation of Transportation of Natural Gas
The transportation and sale for resale of natural gas in interstate commerce are regulated by the Federal Energy Regulatory Commission, or FERC, under the Natural Gas Act of 1938, or NGA, the Natural Gas Policy Act of 1978, or NGPA, and regulations issued under those statutes. FERC regulates interstate natural gas transportation rates and service conditions, which affects the marketing of natural gas that we produce, as well as the revenues we receive for sales of our natural gas. Since 1985, FERC has endeavored to make natural gas transportation more accessible to natural gas buyers and sellers on an open and non‑discriminatory basis. Although FERC’s orders do not directly regulate natural gas producers, they are intended to foster increased competition within all phases of the natural gas industry.
Gathering service, which occurs upstream of jurisdictional transmission services, is regulated by the states onshore and in state waters. Section 1(b) of the NGA exempts natural gas gathering facilities from regulation by FERC as a natural gas company under the NGA. Although FERC has not made any formal determinations with respect to any of our facilities, we believe that the natural gas pipelines in our gathering systems meet the traditional tests FERC has used to establish a pipeline’s status as a gatherer not subject to regulation as a natural gas company. The distinction between FERC‑regulated transmission services and federally unregulated gathering services, however, has been the subject of substantial litigation, and FERC determines whether facilities are gathering facilities on a case‑by‑case basis, so the classification and regulation of our gathering facilities may be subject to change based on future determinations by FERC, the courts or Congress. State regulation of natural gas gathering facilities generally include various safety, environmental and, in some circumstances, nondiscriminatory‑take requirements. Although such regulation has not generally been affirmatively applied by state agencies, natural gas gathering may receive greater regulatory scrutiny in the future.
Intrastate natural gas transportation is also subject to regulation by state regulatory agencies. The basis for intrastate regulation of natural gas transportation and the degree of regulatory oversight and scrutiny given to intrastate natural gas pipeline rates and services varies from state to state. Insofar as such regulation within a particular state will generally affect all intrastate natural gas shippers within the state on a comparable basis, we believe that the regulation of similarly situated intrastate natural gas transportation in any states in which we operate and ship natural gas on an intrastate basis will not affect our operations in any way that is of material difference from those of our competitors. Like the regulation of interstate transportation rates, the regulation of intrastate transportation rates affects the marketing of natural gas that we produce, as well as the revenues we receive for sales of our natural gas.
Regulation of Sales of Natural Gas, NGLs, and Oil
The prices at which we sell natural gas, NGLs, and oil is not currently subject to federal regulation and, for the most part, is not subject to state regulation. FERC, however, regulates interstate natural gas transportation rates, and terms and conditions of transportation service, which affects the marketing of the natural gas we produce, as well as the prices we receive for sales of our natural gas. Similarly, the price we receive from the sale of oil and NGLs is affected by the cost of transporting those products to
market. FERC regulates the transportation of oil and liquids on interstate pipelines under the provision of the Interstate Commerce Act, the Energy Policy Act of 1992 and regulations issued under those statutes. Intrastate transportation of oil, NGLs, and other products, is dependent on pipelines whose rates, terms and conditions of service are subject to regulation by state regulatory bodies under state statutes. In addition, while sales by producers of natural gas and all sales of crude oil, condensate, and NGLs can currently be made at uncontrolled market prices, Congress could reenact price controls in the future.
With regard to our physical sales of these energy commodities and any related hedging activities that we undertake, we are required to observe anti-market manipulation laws and related regulations enforced by the FERC as described below, the U.S. Commodity Futures Trading Commission under Commodity Exchange Act, or CEA, and the Federal Trade Commission, or FTC. We are also subject to various reporting requirements that are designed to facilitate transparency and prevent market manipulation. Should we violate the anti-market manipulation laws and regulations, we could be subject to fines and penalties as well as related third party damage claims by, among others, market participants, sellers, royalty owners and taxing authorities.
The Domenici Barton Energy Policy Act of 2005, or EPAct of 2005 amended the NGA to add an anti‑market manipulation provision which makes it unlawful for any entity to engage in prohibited behavior to be prescribed by FERC, and furthermore provided FERC with additional civil penalty authority. In Order No. 670, FERC promulgated rules implementing the anti‑market manipulation provision of the EPAct of 2005, which make it unlawful to: (1) in connection with the purchase or sale of natural gas subject to the jurisdiction of FERC, or the purchase or sale of transportation services subject to the jurisdiction of FERC, for any entity, directly or indirectly, to use or employ any device, scheme or artifice to defraud; (2) to make any untrue statement of material fact or omit to make any such statement necessary to make the statements made not misleading; or (3) to engage in any act or practice that operates as a fraud or deceit upon any person. The anti‑market manipulation rules do not apply to activities that relate only to intrastate or other non‑jurisdictional sales or gathering, but does apply to activities of gas pipelines and storage companies that provide interstate services, as well as otherwise non‑jurisdictional entities to the extent the activities are conducted “in connection with” gas sales, purchases or transportation subject to FERC jurisdiction, which now includes the annual reporting requirements under Order No. 704 described below. Under the EPAct of 2005, FERC has the power to assess civil penalties of up to $1,000,000 per day for each violation of the NGA and the NGPA.
Under Order No. 704, wholesale buyers and sellers of more than 2.2 million MMBtus of physical natural gas in the previous calendar year, including interstate and intrastate natural gas pipelines, natural gas gatherers, natural gas processors, natural gas marketers and natural gas producers are required to report, on May 1 of each year, aggregate volumes of natural gas purchased or sold at wholesale in the prior calendar year. It is the responsibility of the reporting entity to determine which individual transactions should be reported based on the guidance of Order 704. Order 704 also requires market participants to indicate whether they report prices to any index publishers, and if so, whether their reporting complies with FERC’s policy statement on price reporting.
The CEA prohibits any person from manipulating or attempting to manipulate the price of any commodity in interstate commerce or futures on such commodity. The CEA also prohibits knowingly delivering or causing to be delivered false or misleading or knowingly inaccurate reports concerning market information or conditions that affect or tend to affect the price of a commodity. In November 2009, the FTC issued regulations pursuant to the Energy Independence and Security Act of 2007 intended to prohibit market manipulation in the petroleum industry. Violators of the regulations face civil penalties of up to $1,000,000 per violation per day. Together with FERC, these agencies have imposed broad rules and regulations prohibiting fraud and manipulation in oil and gas markets and energy futures markets.
Changes in law and to FERC policies and regulations may adversely affect the availability and reliability of firm and/or interruptible transportation service on interstate pipelines, and we cannot predict what future action FERC will take. We do not believe, however, that any regulatory changes will affect us in a way that materially differs from the way they will affect other natural gas producers, gatherers and marketers with which we compete.
Regulation of Environmental and Occupational Safety and Health Matters
Our operations are subject to numerous stringent federal, regional, state and local statutes and regulations governing occupational safety and health and the discharge of materials into the environment or otherwise relating to environmental protection. Violations of these laws can result in substantial administrative, civil and criminal penalties. These laws and regulations may require the acquisition of a permit before drilling or other regulated activity commences, restrict the types, quantities and concentrations of various substances that can be released into the environment in connection with drilling, production and transporting through pipelines, govern the sourcing and disposal of water used in the drilling and completion process, limit or prohibit drilling activities in certain areas and on certain lands lying within wilderness, wetlands, frontier and other protected areas, require some form of remedial
action to prevent or mitigate pollution from former operations such as plugging abandoned wells or closing earthen pits, establish specific safety and health criteria addressing worker protection and impose substantial liabilities for pollution resulting from operations or failure to comply with applicable laws and regulations. In addition, these laws and regulations may restrict the rate of production.
The following is a summary of the more significant existing environmental and occupational health and safety laws and regulations, as amended from time to time, to which our business operations are subject and for which compliance may have a material adverse impact on our capital expenditures, results of operations or financial position.
Hazardous Substances and Waste Handling
The Comprehensive Environmental Response, Compensation, and Liability Act, or CERCLA, also known as the “Superfund” law, and comparable state laws impose liability, without regard to fault or the legality of the original conduct, on certain classes of persons that are considered to have contributed to the release of a “hazardous substance” into the environment. These persons include the current and past owner or operator of the disposal site or the site where the release occurred and companies that disposed or arranged for the disposal of the hazardous substances at the site where the release occurred. Under CERCLA, such persons may be subject to joint and several strict liability for the costs of cleaning up the hazardous substances that have been released into the environment and for damages to natural resources, and it is not uncommon for neighboring landowners and other third parties to file claims for personal injury and property damage allegedly caused by the hazardous substances released into the environment. In addition, despite the “petroleum exclusion” of Section 101(14) of CERCLA, which currently encompasses crude oil and natural gas, we generate materials in the course of our operations that may be regulated as hazardous substances based on their characteristics; however, we are unaware of any liabilities arising under CERCLA for which we may be held responsible that would materially and adversely affect us.
The Resource Conservation and Recovery Act, or RCRA, and analogous state laws, establish detailed requirements for the generation, handling, storage, treatment and disposal of nonhazardous and hazardous solid wastes. RCRA specifically excludes drilling fluids, produced waters, and other wastes associated with the exploration, development, or production of crude oil, natural gas or geothermal energy from regulation as hazardous wastes. However, these wastes may be regulated by the U.S. Environmental Protection Agency, or the EPA, or state agencies under RCRA’s less stringent nonhazardous solid waste provisions, or under state laws or other federal laws. Moreover, it is possible that these particular oil and natural gas exploration, development and production wastes now classified as nonhazardous solid wastes could be classified as hazardous wastes in the future. A loss of the RCRA exclusion for drilling fluids, produced waters and related wastes could result in an increase in our costs to manage and dispose of generated wastes, which could have a material adverse effect on our results of operations and financial position. In addition, in the course of our operations, we generate some amounts of ordinary industrial wastes, such as waste solvents, laboratory wastes and waste compressor oils that may become regulated as hazardous wastes if such wastes have hazardous characteristics. Although the costs of managing hazardous waste may be significant, we do not believe that our costs in this regard are materially more burdensome than those for similarly situated companies.
We currently own, lease, or operate numerous properties that have been used for oil and natural gas exploration and production activities for many years. Although we believe that we have utilized operating and waste disposal practices that were standard in the industry at the time, hazardous substances, wastes, or petroleum hydrocarbons may have been released on, under or from the properties owned or leased by us, or on, under or from other locations, including off‑ site locations, where such substances have been taken for recycling or disposal. In addition, some of our properties have been operated by third parties or by previous owners or operators whose treatment and disposal of hazardous substances, wastes, or petroleum hydrocarbons was not under our control. We are able to control directly the operation of only those wells with respect to which we act or have acted as operator. The failure of a prior owner or operator to comply with applicable environmental regulations may, in certain circumstances, be attributed to us as current owners or operators under CERCLA. These properties and the substances disposed or released on, under or from them may be subject to CERCLA, RCRA and analogous state laws. Under such laws, we could be required to undertake response or corrective measures, regardless of fault, which could include removal of previously disposed substances and wastes, cleanup of contaminated property or performance of remedial plugging or waste pit closure operations to prevent future contamination.
Water Discharges
The Federal Water Pollution Control Act, or the Clean Water Act (the “CWA”), and comparable state laws impose restrictions and strict controls regarding the discharge of pollutants, including produced waters and other oil and natural gas wastes, into federal and state waters. The discharge of pollutants into regulated waters is prohibited, except in accordance with the terms of a
permit issued by the EPA or a state equivalent agency. The discharge of dredge and fill material in regulated waters, including wetlands, is also prohibited, unless authorized by a permit issued by the U.S. Army Corps of Engineers. In September 2015, new EPA and U.S. Army Corps of Engineers rules defining the scope of the EPA’s and the Corps’ jurisdiction became effective. To the extent the rule expands the scope of the CWA’s jurisdiction, we could face increased costs and delays with respect to obtaining permits for dredge and fill activities in wetland areas. The rule has been challenged in court on the grounds that it unlawfully expands the reach of CWA programs, and implementation of the rule has been stayed pending resolution of the court challenge. The process for obtaining permits has the potential to delay the development of natural gas and oil projects. Also, pursuant to these laws and regulations, we may be required to obtain and maintain approvals or permits for the discharge of wastewater or storm water and are required to develop and implement spill prevention, control and countermeasure plans, also referred to as “SPCC plans,” in connection with on-site storage of significant quantities of oil. These laws and any implementing regulations provide for administrative, civil and criminal penalties for any unauthorized discharges of oil and other substances in reportable quantities and may impose substantial potential liability for the costs of removal, remediation and damages.
Air Emissions
The federal Clean Air Act and comparable state laws restrict the emission of air pollutants from many sources, such as, for example, compressor stations, through air emissions standards, construction and operating permitting programs and the imposition of other compliance requirements. These laws and regulations may require us to obtain pre‑approval for the construction or modification of certain projects or facilities expected to produce or significantly increase air emissions, obtain and strictly comply with stringent air permit requirements or utilize specific equipment or technologies to control emissions of certain pollutants, the costs of which could be significant. The need to obtain permits has the potential to delay the development of oil and natural gas projects. Over the next several years, we may be required to incur certain capital expenditures for air pollution control equipment or other air emissions related issues. For example, in October 2015, the EPA lowered the National Ambient Air Quality Standard, or NAAQS, for ozone from 75 to 70 parts per billion for both the 8-hour primary and secondary standards. State implementation of the revised NAAQS could result in stricter permitting requirements, delay or prohibit our ability to obtain such permits, and result in increased expenditures for pollution control equipment, the costs of which could be significant. The EPA has also issued final rules under the Clean Air Act that subject oil and natural gas production, processing, transmission and storage operations to regulation under the New Source Performance Standards, or NSPS, and National Emission Standards for Hazardous Air Pollutants, or NESHAP, programs. These final rules require, among other things, the reduction of volatile organic compound, or VOC, emissions from certain fractured and refractured natural gas wells for which well completion operations are conducted and further require that most wells use reduced emission completions, also known as “green completions.” These regulations also establish specific new requirements regarding emissions from production related wet seal and reciprocating compressors, and from pneumatic controllers and storage vessels. Compliance with these and other air pollution control and permitting requirements has the potential to delay the development of natural gas and oil projects and increase our costs of development and production, which costs could be significant. However, we do not believe that compliance with such requirements will have a material adverse effect on our operations.
Regulation of “Greenhouse Gas” Emissions
In response to findings that emissions of carbon dioxide, methane and other greenhouse gases, or GHGs, present an endangerment to public health and the environment, the EPA has adopted regulations under existing provisions of the federal Clean Air Act that, among other things, establish Prevention of Significant Deterioration, or PSD, construction and Title V operating permit reviews for certain large stationary sources. Facilities required to obtain PSD permits for their GHG emissions also will be required to meet “best available control technology” standards that will be established by the states or, in some cases, by the EPA on a case‑by‑case basis. These EPA rulemakings could adversely affect our operations and restrict or delay our ability to obtain air permits for new or modified sources. In addition, the EPA has adopted rules requiring the monitoring and reporting of GHG emissions from specified onshore and offshore oil and gas production sources in the United States on an annual basis, which include certain of our operations. More recently, in December 2015, the EPA finalized rules that added new sources to the scope of the GHG monitoring and reporting rule. These new sources include gathering and boosting facilities as well as completions and workovers from hydraulically fractured oil wells. The revisions also include the addition of well identification reporting requirements for certain facilities. These changes to EPA’s GHG emissions reporting rule could result in increased compliance costs. We are monitoring GHG emissions from our operations in accordance with the GHG emissions reporting rule.
In August 2015, the EPA announced proposed rules that would establish new air emission controls for emissions of methane from certain equipment and processes in the oil and natural gas source category, including production, processing, transmission and storage activities, known as NSPS Quad Oa. The EPA’s proposed rule package includes first-time standards to address emissions of methane from equipment and processes across the source category, including hydraulically fractured oil and natural gas well
completions. In addition, the rule package would extend existing VOC standards under the EPA’s Subpart OOOO of the NSPS, or NSPS Quad O, to include previously unregulated equipment within the oil and natural gas source category. More recently, in January 2016, Pennsylvania announced new rules that will require the Pennsylvania Department of Environmental Protection, or PADEP, to develop a new general permit for oil and gas exploration, development, and production facilities and liquids loading activities, requiring best available technology for equipment and processes, enhanced record-keeping, and quarterly monitoring inspections for the control of methane emissions. The PADEP also intends to issue similar methane rules for existing sources. In addition, the department has also proposed to establish Best Management Practices, including leak detection and repair, or LDAR, programs, to reduce fugitive methane emissions from production, gathering, processing, and transmission facilities. These rules have the potential to increase our compliance costs.
We have been making efforts to reduce methane emissions since March 2005, when we engaged local community groups in Colorado regarding its activities in the Piceance Basin in discussions on how to minimize impacts from its operations. As noted above, in 2012, the EPA promulgated NSPS Quad O, which, among other actions, requires the use of reduced emission completions, or “green completions,” to control emissions of VOCs from hydraulically fractured natural gas wells. Green completions have the added benefit of reducing methane emissions from our operations. The green completions requirements of NSPS Quad O became effective in January 2015, but we have been performing green completions since before the EPA’s rules became effective. We were one of the first operators to implement green completions in Colorado back in July 2011, using equipment that our personnel helped design. After initial testing confirming the viability and effectiveness of the units, we implemented their use in the Appalachian Basin Marcellus shale play in 2012 and later in the Utica shale play. We believe we have a long history of managing methane emissions from our operations, as demonstrated by our longstanding use of green completions.
When we permit a facility, we are required to install pollution control equipment at the wellsite in accordance with the requirements of the NSPS for New Stationary Sources. At wellpads, this consists of installing combustors with a control efficiency of 98% to control tank methane and VOC emissions. In addition to combustors, we also install Vapor Recovery Units, or VRUs, in order to capture methane and VOC emissions and direct them down the sales line, rather than flaring those emissions. Per applicable regulations, we also install low-bleed pneumatic controls at wellpads, which serve to reduce methane emissions. We may also install Vapor Recovery Towers, or VRTs, to further reduce methane and VOC flashing emissions from storage tanks when we have more than a nominal amount of oil production in order to produce sufficient gas to allow safe and proper running of the VRTs. At compressor stations, through the use of non-selective catalytic reduction, we reduce methane and VOC emissions from engines by at least 70%. Compressor Station tank and dehydration units are typically controlled by combustors or VRUs. We control our methane and VOC emissions consistent with available emission control technology as required by law and as applicable to our operations.
Our methane and VOC control program consists of installing the emission controls described above, performing inspections, and conducting preventative maintenance and repairs to minimize emissions leakage. For example, we have implemented an LDAR program for our well pad and compressor station operations. During 2015, we added two fulltime staff members to manage the LDAR program. LDAR program inspections utilize a state of the art Forward Looking Infrared camera to identify equipment leaks. Our Operations group has a maintenance program in place, which includes cleaning, greasing and replacing thief hatch seals, and other measures as required to further minimize the potential for leaks, In 2015, we implemented new thief hatch designs with improved seals for our tanks. While the LDAR program is not mandatory in all areas of our operations, we have implemented it uniformly across all of our activities. We believe that our efforts to date have resulted in a declining volume of methane emissions based on the decreasing number of leaks detected as part of our LDAR program. In addition, since 2011 and in accordance with EPA regulations, we have monitored or calculated our GHG emissions, including emissions of methane, and reported them to the EPA on an annual basis. Our current report of GHG emissions from covered operations during 2015 will be submitted to the EPA by March 31, 2016. Overall, through the use of Green Completions we have seen significant decreases in GHG emissions from our operations. Furthermore, we believe that our efforts to comply with the 2012 NSPS Quad O have resulted in us being well positioned to comply with the EPA’s recently proposed NSPS Quad Oa regulations to reduce methane and VOC emissions from oil and natural gas operations. However, additional compliance measures and expenditures will most likely be required to comply with EPA’s proposal, if finalized.
While Congress has from time to time considered legislation to reduce emissions of GHGs, there has not been significant activity in the form of adopted legislation to reduce GHG emissions at the federal level in recent years. In the absence of such federal climate legislation, a number of state and regional efforts have emerged that are aimed at tracking and/or reducing GHG emissions by means of cap and trade programs that typically require major sources of GHG emissions, such as electric power plants, to acquire and surrender emission allowances in return for emitting those GHGs. Although it is not possible at this time to predict how legislation or new regulations that may be adopted to address GHG emissions would impact our business, any such future laws and regulations imposing reporting obligations on, or limiting emissions of GHGs from, our equipment and operations could require us to incur costs
to reduce emissions of GHGs associated with our operations. Severe limitations on GHG emissions could also adversely affect demand for the oil and natural gas we produce. Finally, it should be noted that some scientists have concluded that increasing concentrations of GHGs in the Earth’s atmosphere may produce climate changes that have significant physical effects, such as increased frequency and severity of storms, floods and other climatic events; if any such effects were to occur, they could have an adverse effect on our exploration and production operations.
Hydraulic Fracturing Activities
Hydraulic fracturing is an important and common practice that is used to stimulate production of natural gas and/or oil from dense subsurface rock formations. The hydraulic fracturing process involves the injection of water, sand, and chemicals under pressure through a cased and cemented wellbore into targeted subsurface formations to fracture the surrounding rock and stimulate production. We regularly use hydraulic fracturing as part of our operations, as does most of the domestic oil and natural gas industry. Hydraulic fracturing typically is regulated by state oil and natural gas commissions, but the EPA has asserted federal regulatory authority pursuant to the federal Safe Drinking Water Act, or the SDWA, over certain hydraulic fracturing activities involving the use of diesel fuels and issued permitting guidance in February 2014 regarding such activities. Also, in May 2014, the EPA proposed rules under the Toxic Substances Control Act to require companies to disclose information regarding the chemicals used in hydraulic fracturing; however, to date, no further action has been taken on the proposal. The EPA also proposed in April 2015 to prohibit the discharge of wastewater from hydraulic fracturing operations to publicly owned wastewater treatment plants.
In addition, Congress has from time to time considered legislation to provide for federal regulation of hydraulic fracturing under the SDWA and to require disclosure of the chemicals used in the hydraulic fracturing process. At the state level, several states have adopted or are considering legal requirements that could impose more stringent permitting, disclosure, and well construction requirements on hydraulic fracturing activities. For example, in January 2016, the PADEP issued new rules establishing stricter disposal requirements for wastes associated with hydraulic fracturing activities, which include, among other things, a prohibition on the use of centralized impoundments for the storage of drill cuttings and waste fluids. Local government also may seek to adopt ordinances within their jurisdictions regulating the time, place and manner of drilling activities in general or hydraulic fracturing activities in particular. Some states and municipalities have sought to ban hydraulic fracturing altogether. We believe that we follow applicable standard industry practices and legal requirements for groundwater protection in our hydraulic fracturing activities. Nonetheless, if new or more stringent federal, state, or local legal restrictions relating to the hydraulic fracturing process are adopted in areas where we operate, we could incur potentially significant added costs to comply with such requirements, experience delays or curtailment in the pursuit of exploration, development, or production activities, and perhaps even be precluded from drilling wells.
Certain governmental reviews have been conducted or are underway that focus on environmental aspects of hydraulic fracturing practices. The White House Council on Environmental Quality is coordinating an administration‑wide review of hydraulic fracturing practices. In June 2015, the EPA released its draft report on the potential impacts of hydraulic fracturing on drinking water resources, which concluded that hydraulic fracturing activities have not led to widespread, systemic impacts on drinking water resources in the United States, although there are above and below ground mechanisms by which hydraulic fracturing activities have the potential to impact drinking water resources. The draft report is expected to be finalized after a public comment period and a formal review by the EPA’s Science Advisory Board. In addition, the U.S. Department of the Interior published a final rule in March 2015 that would implement updated requirements for hydraulic fracturing activities on federal lands, including new requirements relating to public disclosure, well bore integrity and handling of flowback water. The U.S. District Court of Wyoming has temporarily stayed implementation of this rule pending a final decision on whether it may be implemented. Other governmental agencies, including the U.S. Department of Energy have evaluated or are evaluating various other aspects of hydraulic fracturing. These ongoing or proposed studies could spur initiatives to further regulate hydraulic fracturing under the SDWA or other regulatory mechanisms.
Occupational Safety and Health Act
We are also subject to the requirements of the federal Occupational Safety and Health Act, as amended, or OSHA, and comparable state laws that regulate the protection of the health and safety of employees. In addition, OSHA’s hazard communication standard, the Emergency Planning and Community Right to Know Act and implementing regulations and similar state statutes and regulations require that information be maintained about hazardous materials used or produced in our operations and that this information be provided to employees, state and local government authorities, and citizens.
Endangered Species Act
The federal Endangered Species Act, or ESA, provides for the protection of endangered and threatened species. Pursuant to the ESA, if a species is listed as threatened or endangered, restrictions may be imposed on activities adversely affecting that species’ habitat. Similar protections are offered to migratory birds under the Migratory Bird Treaty Act. We conduct operations on natural gas and oil leases in areas where certain species that are listed as threatened or endangered are known to exist and where other species that potentially could be listed as threatened or endangered under the ESA may exist. The U.S. Fish and Wildlife Service, or the USFWS, may designate critical habitat and suitable habitat areas that it believes are necessary for survival of a threatened or endangered species. A critical habitat or suitable habitat designation could result in further material restrictions to federal land use and may materially delay or prohibit access to protected areas for natural gas and oil development. Moreover, as a result of a settlement, the USFWS is required to make a determination as to whether more than 250 species as endangered or threatened should be listed under the ESA by no later than completion of the agency’s 2017 fiscal year. For example, in April 2015, the USFWS listed the northern long-eared bat, whose habitat includes the areas in which we operate, as a threatened species under the ESA. The designation of previously unprotected species as threatened or endangered in areas where underlying property operations are conducted could cause us to incur increased costs arising from species protection measures or could result in limitations on our exploration and production activities that could have an adverse impact on our ability to develop and produce reserves. If we were to have a portion of our leases designated as critical or suitable habitat, it could adversely impact the value of our leases.
Although we have not experienced any material adverse effect from compliance with environmental requirements, there is no assurance that this will continue. We did not have any material capital or other non‑recurring expenditures in connection with complying with environmental laws or environmental remediation matters in 2015, nor do we anticipate that such expenditures will be material in 2016.
Employees
As of December 31, 2015, we had 480 full‑time employees, including 57 in executive, finance, treasury and administration, 22 in geology, 186 in production and engineering, 90 in midstream, 76 in land, and 49 in accounting. Our future success will depend partially on our ability to attract, retain, and motivate qualified personnel. We are not a party to any collective bargaining agreements and have not experienced any strikes or work stoppages. We consider our relations with our employees to be satisfactory. We utilize the services of independent contractors to perform various field and other services.
Address, Internet Website and Availability of Public Filings
Our principal executive offices are located at 1615 Wynkoop Street, Denver, Colorado 80202 and our telephone number is (303) 357‑7310. Our website is located at www.anteroresources.com.
We furnish or file with the Securities and Exchange Commission (the “SEC”) our Annual Reports on Form 10‑K, our Quarterly Reports on Form 10‑Q, and our Current Reports on Form 8‑K. We make these documents available free of charge at www.anteroresources.com under the “Investors Relations” link as soon as reasonably practicable after they are filed or furnished with the SEC.
Information on our website is not incorporated into this Annual Report on Form 10‑K or our other filings with the SEC and is not a part of them.
Item 1A. Risk Factors
Our business involves a high degree of risk. If any of the following risks, or any risk described elsewhere in this Annual Report on Form 10‑K, actually occur, our business, financial condition or results of operations could suffer.
Natural gas, NGLs, and oil prices are volatile. A substantial or extended decline in commodity prices may adversely affect our business, financial condition or results of operations and our ability to meet our capital expenditure obligations and financial commitments.
The prices we receive for our natural gas, NGLs, and oil production heavily influence our revenue, profitability, access to capital and future rate of growth. Natural gas, NGLs, and oil are commodities and, therefore, their prices are subject to wide fluctuations in response to relatively minor changes in supply and demand. Historically, the commodities market has been volatile.
This market will likely continue to be volatile in the future. The prices we receive for our production, and the levels of our production, depend on numerous factors beyond our control. These factors include the following:
|
·
| |
worldwide and regional economic conditions impacting the global supply and demand for natural gas, NGLs and oil; |
|
·
| |
the price and quantity of imports of foreign natural gas, including liquefied natural gas; |
|
·
| |
political conditions in or affecting other producing countries, including conflicts in the Middle East, Africa, South America and Russia; |
|
·
| |
the level of global exploration and production; |
|
·
| |
the level of global inventories; |
|
·
| |
prevailing prices on local price indexes in the areas in which we operate; |
|
·
| |
localized and global supply and demand fundamentals and transportation availability; |
|
·
| |
technological advances affecting energy consumption; |
|
·
| |
the price and availability of alternative fuels; and |
|
·
| |
domestic, local and foreign governmental regulation and taxes. |
In late 2014, global energy commodity prices declined precipitously as a result of several factors, including an increase in worldwide commodity supplies, a stronger U.S. dollar, relatively mild weather in large portions of the U.S. during winter months, and strong competition among oil producing countries for market share. These events continued into 2015 and early 2016 and, along with slower economic growth in China, have led to a further decline in commodity prices. Spot prices for WTI declined from approximately $106.00 per Bbl in June 2014 to less than $50.00 per Bbl in January 2015, and declined further to less than $30.00 per Bbl in January 2016. Spot prices for Henry Hub natural gas declined from approximately $4.40 per MMBtu in January 2014 to $3.00 per MMBtu in January 2015, and declined further to less than $1.80 per MMBtu for a brief period in December 2015. Spot prices for propane, which is the largest source of our NGLs sales revenue, declined from approximately $1.55 per gallon in January 2014 to less than $0.50 per gallon in January 2015, and declined further to less than $0.35 per gallon in January 2016.
Lower commodity prices reduce our cash flows and borrowing ability. We may be unable to obtain needed capital or financing on satisfactory terms, which could lead to a decline in our reserves as existing reserves are depleted. Lower commodity prices may also reduce the amount of natural gas, NGLs and oil that we can produce economically.
If commodity prices further decrease, a significant portion of our exploration and development projects could become uneconomic. This may result in our having to make significant downward adjustments to our estimated proved reserves. As a result, a substantial or extended decline in commodity prices may materially and adversely affect our future business, financial condition, results of operations, liquidity or ability to finance planned capital expenditures.
Our exploration and development projects require substantial capital expenditures. We may be unable to obtain required capital or financing on satisfactory terms, which could lead to a decline in our natural gas reserves.
The natural gas industry is capital intensive. We make and expect to continue to make substantial capital expenditures for the exploration, development, and acquisition of natural gas reserves. Our cash flow used in investing activities related to drilling, completions, and land expenditures was approximately $1.8 billion in 2015. Our board of directors has approved a capital budget for 2016 of $1.4 billion that includes $1.3 billion for drilling and completion and $100 million for core leasehold acreage acquisitions. Our capital budget excludes acquisitions. We expect to fund these capital expenditures with cash generated by operations and borrowings under our revolving credit facility or capital market transactions; however, our financing needs may require us to alter or increase our capitalization substantially through the issuance of debt or equity securities or the sale of assets. The actual amount and
timing of our future capital expenditures may differ materially from our estimates as a result of, among other things, commodity prices, actual drilling results, the availability of drilling rigs and other services and equipment, and regulatory, technological, and competitive developments. A sustained period of commodity prices at current levels or a further reduction in commodity prices from current levels may result in an additional decrease in our actual capital expenditures, which would negatively impact our ability to grow production. For additional discussion of the risks regarding our ability to obtain funding, please read “Item 1A. Risk Factors – The borrowing base under our revolving credit facility is subject to semi-annual redetermination by our lenders, which could result in a reduction of our borrowing base. This may hinder or prevent us from meeting our future capital needs.” The issuance of additional indebtedness would require that a portion of our cash flow from operations be used for the payment of interest and principal on our indebtedness, thereby reducing our ability to use cash flow from operations to fund working capital, capital expenditures and acquisitions.
Our cash flow from operations and access to capital are subject to a number of variables, including:
|
·
| |
the level of hydrocarbons we are able to produce from existing wells; |
|
·
| |
the prices at which our production is sold; |
|
·
| |
our ability to acquire, locate and produce new reserves; and |
|
·
| |
our ability to borrow under our revolving credit facility, including any potential decrease in the borrowing base. |
If our revenues or the borrowing base under our revolving credit facility decrease as a result of lower natural gas prices, operating difficulties, declines in reserves or for any other reason, we may have limited ability to obtain the capital necessary to sustain our operations at current levels. If additional capital is needed, we may not be able to obtain debt or equity financing on terms acceptable to us, if at all. If cash flow generated by our operations or available borrowings under our revolving credit facility are not sufficient to meet our capital requirements, the failure to obtain additional financing could result in a curtailment of our operations relating to development of our properties, which in turn could lead to a decline in our reserves and production, and could adversely affect our business, financial condition and results of operations.
Drilling for and producing natural gas are high risk activities with many uncertainties that could adversely affect our business, financial condition or results of operations.
Our future financial condition and results of operations will depend on the success of our exploration, development and acquisition activities, which are subject to numerous risks beyond our control, including the risk that drilling will not result in commercially viable natural gas production. Our decisions to purchase, explore, or develop prospects or properties will depend in part on the evaluation of data obtained through geophysical and geological analyses, production data and engineering studies, the results of which are often inconclusive or subject to varying interpretations. For a discussion of the uncertainty involved in these processes, see “—Reserve estimates depend on many assumptions that may turn out to be inaccurate. Any material inaccuracies in our reserve estimates or underlying assumptions will materially affect the quantities and present value of our reserves.” In addition, our cost of drilling, completing and operating wells is often uncertain before drilling commences.
Further, many factors may curtail, delay or cancel our scheduled drilling projects, including the following:
|
·
| |
further or prolonged declines in oil, NGLs, and natural gas prices; |
|
·
| |
limitations in the market for oil, NGLs, and natural gas; |
|
·
| |
delays imposed by or resulting from compliance with regulatory requirements; |
|
·
| |
pressure or irregularities in geological formations; |
|
·
| |
shortages of or delays in obtaining equipment and qualified personnel or in obtaining water for hydraulic fracturing activities; |
|
·
| |
equipment failures or accidents; |
|
·
| |
adverse weather conditions, such as blizzards, tornados, hurricanes and ice storms; |
|
·
| |
issues related to compliance with environmental regulations; |
|
·
| |
environmental hazards, such as natural gas leaks, oil spills, pipeline and tank ruptures, encountering naturally occurring radioactive materials, and unauthorized discharges of brine, well stimulation and completion fluids, toxic gases or other pollutants into the surface and subsurface environment; |
|
·
| |
limited availability of financing at acceptable terms; and |
We may not be able to generate sufficient cash to service all of our indebtedness and may be forced to take other actions to satisfy our obligations under our indebtedness, which may not be successful.
Our ability to make scheduled payments on or to refinance our indebtedness obligations, including our revolving credit facility and our senior notes depends on our financial condition and operating performance, which are subject to prevailing economic and competitive conditions and certain financial, business and other factors beyond our control. We may not be able to maintain a level of cash flows from operating activities sufficient to permit us to pay the principal, premium, if any, and interest on our indebtedness, including the senior notes.
If our cash flows and capital resources are insufficient to fund our debt service obligations, we may be forced to reduce or delay investments and capital expenditures, sell assets, seek additional capital or restructure or refinance our indebtedness, including the senior notes. Our ability to restructure or refinance our indebtedness will depend on the condition of the capital markets, including the market for senior unsecured notes, and our financial condition at such time. Any refinancing of our indebtedness could be at higher interest rates and may require us to comply with more onerous covenants, which could further restrict our business operations. The terms of existing or future debt instruments, including the indentures governing our senior notes, may restrict us from adopting some of these alternatives. In addition, any failure to make payments of interest and principal on our outstanding indebtedness on a timely basis would likely result in a reduction of our credit rating, which could harm our ability to incur additional indebtedness. In the absence of sufficient cash flows and capital resources, we could face substantial liquidity problems and might be required to dispose of material assets or operations to meet our debt service and other obligations. Our revolving credit facility and the indentures governing our senior notes currently restrict our ability to dispose of assets and our use of the proceeds from such disposition. We may not be able to consummate those dispositions, and the proceeds of any such disposition may not be adequate to meet any debt service obligations then due. These alternative measures may not be successful and may not permit us to meet our scheduled debt service obligations.
The borrowing base under our revolving credit facility may be reduced in light of recent commodity price declines, which could hinder or prevent us from meeting our future capital needs.
The borrowing base under our revolving credit facility is currently $4.5 billion, and lender commitments under our revolving credit facility are $4.0 billion. Our borrowing base is redetermined by the lenders twice per year, and the next scheduled borrowing base redetermination is expected to occur in April 2016. Our borrowing base may decrease as a result of current oil and natural gas price levels, a further decline in oil or natural gas prices, operating difficulties, declines in reserves, lending requirements or regulations, the issuance of new indebtedness or for any other reason. We cannot be certain that funding will be available if needed, and to the extent required, on acceptable terms. In the event of a decrease in our borrowing base due to current or further declines in commodity prices or otherwise, we may be unable to meet our obligations as they come due and could be required to repay any indebtedness in excess of the redetermined borrowing base. In addition, we may be unable to access the equity or debt capital markets, including the market for senior unsecured notes, to meet our obligations. As a result, we may be unable to implement our drilling and development plan, make acquisitions or otherwise carry out our business plan, which would have a material adverse effect on our financial condition and results of operations and impair our ability to service our indebtedness.
We may be unable to access the equity or debt capital markets, including the market for senior unsecured notes, to meet our obligations.
Due to the decline in commodity prices in 2014 and 2015 and the sustained weakness in commodity prices through the first quarter of 2016, the financial markets have exerted downward pressure on stock prices and credit capacity for companies throughout the energy industry. In particular, the market for senior unsecured notes has become unfavorable for high-yield issuers such as us. Our plans for growth require regular access to the capital and credit markets, including the ability to issue senior unsecured notes. If the market for high-yield debt securities does not improve, or if we are unable to access alternative means of financing on acceptable terms, we may be unable to implement our drilling and development plan, make acquisitions or otherwise carry out our business plan, which could have a material adverse effect on our financial condition and results of operations and impair our ability to service our indebtedness.
The development of our estimated proved undeveloped reserves may take longer and may require higher levels of capital expenditures than we currently anticipate. Therefore, our estimated proved undeveloped reserves may not be ultimately developed or produced.
At December 31, 2015, 56% of our total estimated proved reserves were classified as proved undeveloped. Our approximately 7.4 Tcfe of estimated proved undeveloped reserves will require an estimated $5.1 billion of development capital over the next five years. Moreover, the development of probable and possible reserves will require additional capital expenditures and such reserves are less certain to be recovered than proved reserves. Development of these undeveloped reserves may take longer and require higher levels of capital expenditures than we currently anticipate. Delays in the development of our reserves, increases in costs to drill and develop such reserves, or decreases in commodity prices will reduce the PV‑10 value of our estimated proved undeveloped reserves and future net revenues estimated for such reserves and may result in some projects becoming uneconomic. In addition, delays in the development of reserves could cause us to have to reclassify our proved undeveloped reserves as unproved reserves.
We are required to pay fees to our service providers based on minimum volumes under long-term contracts regardless of actual volume throughput.
We have various firm transportation, gas processing, gathering and compression service and water handling and treatment agreements in place, each with minimum volume delivery commitments. Lower commodity prices may lead to reductions in our drilling program, which may result in insufficient production to utilize our full firm transportation and processing capacity. Our firm transportation agreements expire at various dates from 2018 to 2045, our gas processing, gathering, and compression services agreements expire at various dates from 2016 to 2028, and our water services agreement with Antero Midstream expires in 2035. We are obligated to pay fees on minimum volumes to our service providers regardless of actual volume throughput. As of December 31, 2015, our long‑term contractual obligations under agreements with minimum volume commitments totaled over $17 billion over the term of the contracts. If we have insufficient production to meet the minimum volumes, our cash flow from operations will be reduced, which may require us to reduce or delay our planned investments and capital expenditures or seek alternative means of financing, all of which may have a material adverse effect on our results or operations.
Based on current projected 2016 annual production levels, we estimate that we could incur total annual net marketing costs of $95 million to $125 million in 2016 for unutilized transportation capacity depending on the amount of unutilized capacity that can be marketed to third parties or utilized to transport third party gas and capture positive basis differentials. Additionally, in years subsequent to 2016, our commitments and obligations under firm transportation agreements continue to increase and our net marketing expense could continue to increase depending on utilization of our transportation capacity based on future production and how much, if any, future excess transportation can be marketed to third parties.
Federal, state and local legislative and regulatory initiatives relating to hydraulic fracturing as well as governmental reviews of such activities could result in increased costs and additional operating restrictions or delays in the completion of oil and natural gas wells and adversely affect our production.
Hydraulic fracturing is an important and common practice that is used to stimulate production of natural gas and/or oil from dense subsurface rock formations. The hydraulic fracturing process involves the injection of water, sand, and chemicals under pressure through a cased and cemented wellbore into targeted subsurface formations to fracture the surrounding rock and stimulate production. We regularly use hydraulic fracturing as part of our operations, as does most of the domestic oil and natural gas industry. Hydraulic fracturing typically is regulated by state oil and natural gas commissions, but the EPA has asserted federal regulatory authority pursuant to the SDWA over certain hydraulic fracturing activities involving the use of diesel fuels and issued permitting guidance in February 2014 regarding such activities. Also, in May 2014, the EPA proposed rules under the Toxic Substances Control Act to require companies to disclose information regarding the chemicals used in hydraulic fracturing; however, to date, no further action has
been taken on the proposal. The EPA also proposed in April 2015 to prohibit the discharge of wastewater from hydraulic fracturing operations to publicly owned wastewater treatment plants.
In addition, Congress has from time to time considered legislation to provide for federal regulation of hydraulic fracturing under the SDWA and to require disclosure of the chemicals used in the hydraulic fracturing process. At the state level, several states have adopted or are considering legal requirements that could impose more stringent permitting, disclosure, and well construction requirements on hydraulic fracturing activities. For example, in January 2016, the PADEP issued new rules establishing stricter disposal requirements for wastes associated with hydraulic fracturing activities, which include, among other things, a prohibition on the use of centralized impoundments for the storage of drill cuttings and waste fluids. Local government also may seek to adopt ordinances within their jurisdictions regulating the time, place and manner of drilling activities in general or hydraulic fracturing activities in particular. Some states and municipalities have sought to ban hydraulic fracturing altogether. We believe that we follow applicable standard industry practices and legal requirements for groundwater protection in our hydraulic fracturing activities. Nonetheless, if new or more stringent federal, state, or local legal restrictions relating to the hydraulic fracturing process are adopted in areas where we operate, we could incur potentially significant added costs to comply with such requirements, experience delays or curtailment in the pursuit of exploration, development, or production activities, and perhaps even be precluded from drilling wells.
Certain governmental reviews have been conducted or are underway that focus on environmental aspects of hydraulic fracturing practices. The White House Council on Environmental Quality is coordinating an administration wide review of hydraulic fracturing practices. In June 2015, the EPA released its draft report on the potential impacts of hydraulic fracturing on drinking water resources, which concluded that hydraulic fracturing activities have not led to widespread, systemic impacts on drinking water resources in the United States, although there are above and below ground mechanisms by which hydraulic fracturing activities have the potential to impact drinking water resources. The draft report is expected to be finalized after a public comment period and a formal review by the EPA’s Science Advisory Board.. In addition, the U.S. Department of the Interior published a final rule in March 2015 that would implement updated requirements for hydraulic fracturing activities on federal lands, including new requirements relating to public disclosure, well bore integrity and handling of flowback water. The U.S. District Court of Wyoming has temporarily stayed implementation of this rule. A final decision is pending, however. Other governmental agencies, including the U.S. Department of Energy have evaluated or are evaluating various other aspects of hydraulic fracturing. These ongoing or proposed studies could spur initiatives to further regulate hydraulic fracturing under the SDWA or other regulatory mechanisms.
Restrictions in our existing and future debt agreements could limit our growth and our ability to engage in certain activities.
Our revolving credit facility contains a number of significant covenants (in addition to covenants restricting the incurrence of additional indebtedness), including restrictive covenants that may limit our ability to, among other things:
|
·
| |
hedge future production; |
|
·
| |
engage in certain other transactions without the prior consent of the lenders. |
The indentures governing our senior notes contain similar restrictive covenants. In addition, our revolving credit facility requires us to maintain certain financial ratios or to reduce our indebtedness if we are unable to comply with such ratios. These restrictions, together with those in the indentures governing our senior notes, may also limit our ability to obtain future financings to withstand a future downturn in our business or the economy in general, or to otherwise conduct necessary corporate activities. We may also be prevented from taking advantage of business opportunities that arise because of the limitations that the restrictive covenants under the indentures governing our senior notes and our revolving credit facility impose on us.
Our revolving credit facility limits the amounts we can borrow up to a borrowing base amount, which the lenders, in their sole discretion, determine on a semi‑annual basis based upon projected revenues from the natural gas properties securing our loan. The lenders can unilaterally adjust the borrowing base and the borrowings permitted to be outstanding under our revolving credit facility. Any increase in the borrowing base requires the consent of the lenders holding 100% of the commitments. If the requisite number of lenders do not agree to an increase, then the borrowing base will be the lowest borrowing base acceptable to such lenders. For additional discussion of the risks regarding our ability to obtain funding under our revolving credit facility, please read “Item 1A. Risk Factors – A sustained decline of oil and natural gas prices may affect our ability to obtain funding, obtain funding on acceptable terms or obtain funding under our revolving credit facility. This may hinder or prevent us from meeting our future capital needs.”
A breach of any covenant in our revolving credit facility would result in a default under that agreement after any applicable grace periods. A default, if not waived, could result in acceleration of the indebtedness outstanding under the facility and in a default with respect to, and an acceleration of, the indebtedness outstanding under other debt agreements. The accelerated indebtedness would become immediately due and payable. If that occurs, we may not be able to make all of the required payments or borrow sufficient funds to refinance such indebtedness. Even if new financing were available at that time, it may not be on terms that are acceptable to us.
Increases in interest rates could adversely affect our business.
Our business and operating results can be harmed by factors such as the availability, terms of and cost of capital, increases in interest rates or a reduction in credit rating. These changes could cause our cost of doing business to increase, limit our ability to pursue acquisition opportunities, reduce cash flow used for drilling and place us at a competitive disadvantage. For example, during 2015, we had estimated average outstanding borrowings under our revolving credit facilities of approximately $1.2 billion, and the impact of a 1.0% increase in interest rates on this amount of indebtedness would result in increased interest expense for that period of approximately $12 million and a corresponding decrease in our net income before the effects of income taxes. Recent and continuing disruptions and volatility in the global financial markets may lead to a contraction in credit availability impacting our ability to finance our operations. We require continued access to capital. A significant reduction in cash flows from operations or the availability of credit could materially and adversely affect our ability to achieve our planned growth and operating results.
Currently, we receive significant incremental cash flows as a result of our hedging activity. To the extent we are unable to obtain future hedges at effective prices consistent with those we have received to date and natural gas prices do not improve, our cash flows may be adversely impacted. Additionally, if development drilling costs increase significantly in the future, our hedged revenues may not be sufficient to cover our costs.
To achieve more predictable cash flows and reduce our exposure to downward price fluctuations, as of December 31, 2015, we had entered into a number of hedge contracts for approximately 3.5 Tcfe of our projected natural gas, NGLs, and oil production through December 31, 2022. We are currently realizing a significant benefit from these hedge positions. For example, for the years ended December 31, 2014 and 2015, we received approximately $136 million and $857 million, respectively, in revenues from cash settled derivatives pursuant to our hedges. Many of the hedge agreements that resulted in these realized gains for the years ended December 31, 2014 and 2015 were executed at times when spot and future prices were higher than prices that we are currently able to obtain in the futures market, and the price at which we have been able to hedge future production has decreased as a result. The sustained weakness in commodity prices in 2015 and through the first quarter of 2016 has adversely affected our ability to hedge future production, particularly on a local basis. If we are unable to enter into new hedge contracts in the future at favorable pricing and for a sufficient amount of our production, our financial condition and results of operations could be materially adversely affected.
Additionally, since we have financial derivatives in place in order to hedge against price declines for a significant part of our estimated future production, we have fixed a significant part of our overall future revenues. For example, for the years ended December 31, 2014 and 2015, approximately 73% and 88%, respectively, of our production was protected by price declines from our financial derivative contracts. If development drilling costs increase significantly because of inflation, increased demand for oilfield services, increased costs to comply with regulations governing our industry or other factors, the payments we receive under these derivative contracts may not be sufficient to cover our costs.
Our derivative activities could result in financial losses or could reduce our earnings. In certain circumstances, we may have to make cash payments under our hedging arrangements and these payments could be significant.
To achieve more predictable cash flows and reduce our exposure to adverse fluctuations in the prices of natural gas, NGLs, and oil we enter into derivative instrument contracts for a significant portion of our natural gas production, including fixed‑price
swaps. As of December 31, 2015, we had entered into hedging contracts through December 31, 2022 covering a total of approximately 3.5 Tcfe of our projected natural gas, NGLs, and oil production at an average index price of $3.79 per MMBtu. Accordingly, our earnings may fluctuate significantly as a result of changes in fair value of our derivative instruments.
Derivative instruments also expose us to the risk of financial loss in some circumstances, including when:
|
·
| |
the counterparty to the derivative instrument defaults on its contractual obligations; |
|
·
| |
there is an increase in the differential between the underlying price in the derivative instrument and actual prices received; or |
|
·
| |
there are issues with regard to legal enforceability of such instruments. |
The use of derivatives may, in some cases, require the posting of cash collateral with counterparties. If we enter into derivative instruments that require cash collateral and commodity prices or interest rates change in a manner adverse to us, our cash otherwise available for use in our operations would be reduced which could limit our ability to make future capital expenditures and make payments on our indebtedness, and which could also limit the size of our borrowing base. Future collateral requirements will depend on arrangements with our counterparties, highly volatile oil and natural gas prices and interest rates.
In addition, derivative arrangements could limit the benefit we would receive from increases in the prices for natural gas, NGLs, and oil, which could also have an adverse effect on our financial condition. If natural gas or oil prices upon settlement of our derivative contracts exceed the price at which we have hedged our commodities, we will be obligated to make cash payments to our hedge counterparties, which could, in certain circumstances, be significant.
Our hedging transactions expose us to counterparty credit risk.
As of December 31, 2015, the estimated fair value of our commodity derivative contracts was approximately $3.1 billion. Any default by the counterparties to these derivative contracts when they become due would have a material adverse effect on our financial condition and results of operations. The fair value of our commodity derivative contracts at December 31, 2015 includes the following values by bank counterparty: Morgan Stanley—$691 million; Barclays—$593 million; JP Morgan—$575 million; Citigroup—$362 million; Wells Fargo—$285 million; Scotiabank—$214 million; BNP Paribas—$188 million; Toronto Dominion Bank—$76 million; Fifth Third Bank—$41 million; Canadian Imperial Bank of Commerce—$37 million; Bank of Montreal—$29 million; SunTrust—$17 million; Capital One—$8 million; and Natixis—$1 million. The credit ratings of certain of these banks have been downgraded in recent years because of the sovereign debt crisis in Europe.
Our hedging transactions expose us to risk of financial loss if a counterparty fails to perform under a derivative contract. Disruptions in the financial markets could lead to sudden decreases in a counterparty’s liquidity, which could make them unable to perform under the terms of the derivative contract and we may not be able to realize the benefit of the derivative contract.
Reserve estimates depend on many assumptions that may turn out to be inaccurate. Any material inaccuracies in our reserve estimates or underlying assumptions will materially affect the quantities and present value of our reserves.
The process of estimating natural gas and oil reserves is complex. It requires interpretations of available technical data and many assumptions, including assumptions relating to current and future economic conditions and commodity prices. Any significant inaccuracies in these interpretations or assumptions could materially affect our estimated quantities and present value of our reserves.
In order to prepare our estimates, we must project production rates and timing of development expenditures. We must also analyze available geological, geophysical, production and engineering data. The extent, quality and reliability of this data can vary.
The process also requires economic assumptions about matters such as realized prices, drilling and operating expenses, capital expenditures, taxes and availability of funds.
Actual future production, realized prices, revenues, taxes, development expenditures, operating expenses and quantities of recoverable reserves will vary from our estimates. Any significant variance could materially affect the estimated quantities and present value of our reserves. In addition, we may adjust our reserve estimates to reflect production history, results of exploration and development, existing commodity prices and other factors, many of which are beyond our control.
You should not assume that the present value of future net revenues from our reserves is the current market value of our estimated reserves. We generally base the estimated discounted future net cash flows from our reserves on prices and costs on the date of the estimate. Actual future prices and costs may differ materially from those used in the present value estimate.
Our identified potential well locations are scheduled out over many years, making them susceptible to uncertainties that could materially alter the occurrence or timing of their drilling. In addition, we may not be able to raise the substantial amount of capital that would be necessary to drill our potential well locations.
Our management team has specifically identified and scheduled certain well locations as an estimation of our future multi‑year drilling activities on our existing acreage. These well locations represent a significant part of our growth strategy. Our ability to drill and develop these locations depends on a number of uncertainties, including natural gas and oil prices, the availability and cost of capital, drilling and production costs, availability of drilling services and equipment, drilling results, lease expirations, gathering system and pipeline transportation constraints, access to and availability of water sourcing and distribution systems, regulatory approvals and other factors. Because of these uncertain factors, we do not know if the numerous potential well locations we have identified will ever be drilled or if we will be able to produce natural gas or oil from these or any other potential well locations. In addition, unless production is established within the spacing units covering the undeveloped acres on which some of the potential locations are obtained, the leases for such acreage will expire. As such, our actual drilling activities may materially differ from those presently identified. For more information on our future potential acreage expirations, see “Item 1. Business and Properties—Our Properties and Operations—Acreage—Undeveloped Acreage Expirations.”
As of December 31, 2015, we had 3,719 identified potential horizontal well locations. As a result of the limitations described above, we may be unable to drill many of our potential well locations. In addition, we will require significant additional capital over a prolonged period in order to pursue the development of these locations, and we may not be able to raise or generate the capital required to do so. Any drilling activities we are able to conduct on these potential locations may not be successful or result in our ability to add additional proved reserves to our overall proved reserves or may result in a downward revision of our estimated proved reserves, which could have a material adverse effect on our future business and results of operations. For more information on our identified potential well locations, see “Item 1. Business and Properties—Our Properties and Operations—Estimated Proved Reserves—Identification of Potential Well Locations.”
Approximately 85% of our net leasehold acreage is undeveloped, and that acreage may not ultimately be developed or become commercially productive, which could cause us to lose rights under our leases as well as have a material adverse effect on our oil and natural gas reserves and future production and, therefore, our future cash flow and income.
Approximately 85% of our net leasehold acreage is undeveloped, or acreage on which wells have not been drilled or completed to a point that would permit the production of commercial quantities of oil and natural gas regardless of whether such acreage contains proved reserves. In addition, approximately 48% and 72% of our natural gas leases related to our Marcellus and Utica acreage, respectively, require us to drill wells that are commercially productive, and if we are unsuccessful in drilling such wells, we could lose our rights under such leases. Our future oil and natural gas reserves and production and, therefore, our future cash flow and income are highly dependent on successfully developing our undeveloped leasehold acreage. For more information on our future potential acreage expirations, see “Item 1. Business and Properties—Our Properties and Operations—Acreage—Undeveloped Acreage Expirations.”
Our producing properties are concentrated in the Appalachian Basin, making us vulnerable to risks associated with operating in one major geographic area.
Our producing properties are geographically concentrated in the Appalachian Basin in West Virginia, Ohio and Pennsylvania. At December 31, 2015, all of our total estimated proved reserves were attributable to properties located in this area. As a result of this concentration, we may be disproportionately exposed to the impact of regional supply and demand factors, delays or interruptions of production from wells in this area caused by governmental regulation, processing or transportation capacity constraints, market limitations, water shortages or other drought related conditions or interruption of the processing or transportation of oil, natural gas or NGLs. Furthermore, substantially all of our liquids rich natural gas is process at two processing facilities. If service interruptions are experienced at either facility, it would lead to a decline in our production and could adversely affect our business, financial condition and results of operations.
We may incur losses as a result of title defects in the properties in which we invest.
It is our practice in acquiring oil and gas leases or interests not to incur the expense of retaining lawyers to examine the title to the mineral interest at the time of acquisition. Rather, we rely upon the judgment of oil and gas lease brokers or landmen who perform the fieldwork in examining records in the appropriate governmental office before attempting to acquire a lease in a specific mineral interest. Leases in the Appalachian Basin are particularly vulnerable to title deficiencies due to the long history of land ownership in the area, resulting in extensive and complex chains of title. Additionally, there are claims against us alleging that certain acquired leases that are held by production are invalid due to production from the producing horizons being insufficient to hold title to the formation rights that we have purchased. The existence of a material title deficiency can render a lease worthless and can adversely affect our results of operations and financial condition. While we do typically obtain title opinions prior to commencing drilling operations on a lease or in a unit, the failure of title may not be discovered until after a well is drilled, in which case we may lose the lease and the right to produce all or a portion of the minerals under the property.
If commodity prices decrease to a level such that our future undiscounted cash flows from our properties are less than their carrying value for a significant period of time, we will be required to take write‑downs of the carrying values of our properties.
Accounting rules require that we periodically review the carrying value of our properties for possible impairment if the estimated future undiscounted cash flows are less than the carrying value of our properties. Based on specific market factors and circumstances at the time of prospective impairment reviews, and the continuing evaluation of development plans, production data, economics and other factors, we may be required to write-down the carrying value of our properties. A write-down constitutes a non‑cash charge to earnings. We may incur impairment charges in the future, which could have a material adverse effect on our results of operations for the periods in which such charges are taken.
Unless we replace our reserves with new reserves and develop those reserves, our reserves and production will decline, which would adversely affect our future cash flows and results of operations.
Producing natural gas reservoirs generally are characterized by declining production rates that vary depending upon reservoir characteristics and other factors. Unless we conduct successful ongoing exploration and development activities or continually acquire properties containing proved reserves, our proved reserves will decline as those reserves are produced. Our future natural gas reserves and production, and therefore our future cash flow and results of operations, are highly dependent on our success in efficiently developing our current reserves and economically finding or acquiring additional recoverable reserves. We may not be able to develop, find or acquire sufficient additional reserves to replace our current and future production. If we are unable to replace our current and future production, the value of our reserves will decrease, and our business, financial condition and results of operations would be adversely affected.
Conservation measures and technological advances could reduce demand for oil and natural gas.
Fuel conservation measures, alternative fuel requirements, increasing consumer demand for alternatives to oil and natural gas, technological advances in fuel economy and energy generation devices could reduce demand for oil and natural gas. The impact of the changing demand for oil and gas services and products may have a material adverse effect on our business, financial condition, results of operations and cash flows.
The inability of our significant customers to meet their obligations to us may adversely affect our financial results.
In addition to credit risk related to receivables from commodity derivative contracts, our principal exposures to credit risk are through joint interest receivables ($35 million at December 31, 2015) and the sale of our production ($124 million in receivables at December 31, 2015), which we market to energy marketing companies, end users, and refineries. Joint interest receivables arise from billing entities who own partial interest in the wells we operate. These entities participate in our wells primarily based on their ownership in leased properties on which we wish to drill. We can do very little to choose who participates in our wells. We are also subject to credit risk due to concentration of our natural gas receivables with several significant customers. The largest purchaser of our natural gas during the twelve months ended December 31, 2015 purchased approximately 19% of our operated production. We do not require all of our customers to post collateral. The inability or failure of our significant customers to meet their obligations to us or their insolvency or liquidation may adversely affect our financial results.
Our operations may be exposed to significant delays, costs and liabilities as a result of environmental and occupational health and safety requirements applicable to our business activities.
We may incur significant delays, costs and liabilities as a result of environmental and occupational health and safety requirements applicable to our exploration, development and production activities. These delays, costs and liabilities could arise under a wide range of federal, regional, state and local laws and regulations relating to protection of the environment and worker health and safety, including regulations and enforcement policies that have tended to become increasingly strict over time resulting in longer waiting periods to receive permits and other regulatory approvals. Failure to comply with these laws and regulations may result in the assessment of administrative, civil and criminal penalties, imposition of cleanup and site restoration costs and liens, and, in some instances, issuance of orders or injunctions limiting or requiring discontinuation of certain operations.
For example, we have received a Notice of Violation, or “NOV”, from the West Virginia Department of Environmental Protection, or WVDEP, related to a drilling incident that occurred in Doddridge County, West Virginia. In September 2014, while drilling a new well, our drilling contractor came into contact with an existing well, resulting in a release of methane gas and potential temporary impacts to groundwater. Groundwater monitoring to date has not identified any significant concerns related to this incident. We continue to work with the WVDEP to resolve this matter but believe it could result in monetary sanctions exceeding $100,000.
Strict, joint and several liabilities may be imposed under certain environmental laws, which could cause us to become liable for the conduct of others or for consequences of our own actions that were in compliance with all applicable laws at the time those actions were taken. In addition, claims for damages to persons or property, including natural resources, may result from the environmental and worker health and safety impacts of our operations. We have been named from time to time as a defendant in litigation related to such matters. For example, we have been named as the defendant in separate lawsuits in Colorado, West Virginia and Pennsylvania in which the plaintiffs have alleged that our oil and natural gas activities exposed them to hazardous substances and damaged their properties. The plaintiffs have requested unspecified damages and other injunctive or equitable relief. We are not yet able to estimate what our aggregate exposure for monetary or other damages resulting from these or other similar claims might be. Also, new laws, regulations or enforcement policies could be more stringent and impose unforeseen liabilities or significantly increase compliance costs. If we were not able to recover the resulting costs through insurance or increased revenues, our business, financial condition or results of operations could be adversely affected.
We may incur substantial losses and be subject to substantial liability claims as a result of our operations. Additionally, we may not be insured for, or our insurance may be inadequate to protect us against, these risks.
We are not insured against all risks. Losses and liabilities arising from uninsured and underinsured events could materially and adversely affect our business, financial condition or results of operations.
Our natural gas exploration and production activities are subject to all of the operating risks associated with drilling for and producing natural gas, including the possibility of:
|
·
| |
environmental hazards, such as uncontrollable releases of oil, natural gas, brine, well fluids, toxic gas or other pollution into the environment, including groundwater, air and shoreline contamination; |
|
·
| |
abnormally pressured formations; |
|
·
| |
mechanical difficulties, such as stuck oilfield drilling and service tools and casing collapse; |
|
·
| |
fires, explosions and ruptures of pipelines; |
|
·
| |
personal injuries and death; |
|
·
| |
terrorist attacks targeting natural gas and oil related facilities and infrastructure. |
Any of these risks could adversely affect our ability to conduct operations or result in substantial loss to us as a result of claims for:
|
·
| |
injury or loss of life; |
|
·
| |
damage to and destruction of property, natural resources and equipment; |
|
·
| |
pollution and other environmental damage; |
|
·
| |
regulatory investigations and penalties; |
|
·
| |
suspension of our operations; and |
|
·
| |
repair and remediation costs. |
We may elect not to obtain insurance for any or all of these risks if we believe that the cost of available insurance is excessive relative to the risks presented. In addition, pollution and environmental risks generally are not fully insurable. The occurrence of an event that is not fully covered by insurance could have a material adverse effect on our business, financial condition and results of operations.
We may be limited in our ability to choose gathering operators, processing and fractionation services providers and water services providers in our areas of operations pursuant to our agreements with Antero Midstream.
Pursuant to the gas gathering and compression agreement that we have entered into with Antero Midstream, we have dedicated the gathering and compression of all of our current and future natural gas production in West Virginia, Ohio and Pennsylvania to Antero Midstream, so long as such production is not otherwise subject to a pre‑existing dedication. Further, pursuant to the right of first offer that we have entered into with Antero Midstream, Antero Midstream has a right to bid to provide certain processing, fractionation, transportation and marketing services in respect of all of our current and future gas production (as long as it is not subject to a pre‑existing dedication) and will be entitled to provide such services if its bid matches or is more favorable to us than terms proposed by other parties. As a result, we will be limited in our ability to use other gathering and compression operators in West Virginia, Ohio and Pennsylvania, even if such operators are able to offer us more favorable pricing or more efficient service. We will also be limited in our ability to use other processing, fractionation, transportation and marketing services providers in any area to the extent Antero Midstream is able to offer a competitive bid.
In connection with the closing of the sale of our water handling and treatment business to Antero Midstream on September 23, 2015, we entered into a Water Services Agreement with Antero Water. Pursuant to the Water Services Agreement, we dedicated the provision of fresh water and wastewater services in defined service areas in Ohio and West Virginia to Antero Midstream. Additionally, the Water Services Agreement provides Antero Midstream with a right of first offer on any future areas of operation outside of Ohio and West Virginia. As a result, we will be limited in our ability to use other water services providers in the dedication areas of Ohio and West Virginia or other future areas of operation, even if such providers are able to offer us more favorable pricing or more efficient service.
Properties that we decide to drill may not yield natural gas or oil in commercially viable quantities.
Properties that we decide to drill that do not yield natural gas or oil in commercially viable quantities will adversely affect our results of operations and financial condition. There is no way to predict in advance of drilling and testing whether any particular prospect will yield natural gas or oil in sufficient quantities to recover drilling or completion costs or to be economically viable. The use of micro‑seismic data and other technologies and the study of producing fields in the same area will not enable us to know conclusively prior to drilling whether natural gas or oil will be present or, if present, whether natural gas or oil will be present in commercial quantities. We cannot assure you that the analogies we draw from available data from other wells, more fully explored prospects or producing fields will be applicable to our drilling prospects. Further, our drilling operations may be curtailed, delayed or cancelled as a result of numerous factors, including:
|
·
| |
unexpected drilling conditions; |
|
·
| |
pressure or lost circulation in formations; |
|
·
| |
equipment failure or accidents; |
|
·
| |
adverse weather conditions; |
|
·
| |
compliance with environmental and other governmental or contractual requirements; and |
|
·
| |
increase in the cost of, shortages or delays in the availability of, electricity, supplies, materials, drilling or workover rigs, equipment and services. |
Market conditions or operational impediments may hinder our access to natural gas, NGLs, and oil markets or delay our production.
Market conditions or the unavailability of satisfactory natural gas, NGLs, and oil transportation arrangements may hinder our access to natural gas, NGLs, and oil markets or delay our production. The availability of a ready market for our natural gas and oil production depends on a number of factors, including the demand for and supply of natural gas, NGLs, and oil and the proximity of reserves to pipelines and terminal facilities. Our ability to market our production depends in substantial part on the availability and capacity of gathering systems, pipelines, and processing facilities owned and operated by third parties. Our failure to obtain such services on acceptable terms could materially harm our business. We may be required to shut in wells due to lack of a market or inadequacy or unavailability of natural gas, NGLs, and oil pipelines or gathering system capacity. In addition, if natural gas, NGLs, or oil quality specifications for the third‑party natural gas, NGLs, or oil pipelines with which we connect change so as to restrict our ability to transport natural gas, NGLs, or oil, our access to natural gas, NGLs, and oil markets could be impeded. If our production becomes shut in for any of these or other reasons, we would be unable to realize revenue from those wells until other arrangements were made to deliver the products to market.
We are subject to complex federal, state, local and other laws and regulations that could adversely affect the cost, manner or feasibility of conducting our operations or expose us to significant liabilities.
Our natural gas exploration, production and transportation operations are subject to complex and stringent laws and regulations. In order to conduct our operations in compliance with these laws and regulations, we must obtain and maintain numerous permits, approvals and certificates from various federal, state and local governmental authorities. We may incur substantial costs in order to maintain compliance with these existing laws and regulations. In addition, our costs of compliance may increase if existing laws and regulations are revised or reinterpreted, or if new laws and regulations become applicable to our operations. Such costs could have a material adverse effect on our business, financial condition and results of operations.
Our business is subject to federal, state and local laws and regulations as interpreted and enforced by governmental authorities possessing jurisdiction over various aspects of the exploration for, and the production and transportation of, natural gas, NGLs, and oil. Failure to comply with such laws and regulations, including any evolving interpretation and enforcement by governmental authorities, could have a material adverse effect on our business, financial condition and results of operations.
Changes to existing or new regulations may unfavorably impact us, could result in increased operating costs and have a material adverse effect on our financial condition and results of operations. Such potential regulations could increase our operating costs, reduce our liquidity, delay or halt our operations or otherwise alter the way we conduct our business, which could in turn have a material adverse effect on our financial condition, results of operations and cash flows.
The unavailability or high cost of additional drilling rigs, equipment, supplies, personnel, and oilfield services could adversely affect our ability to execute our exploration and development plans within our budget and on a timely basis.
The demand for qualified and experienced field personnel to drill wells and conduct field operations, geologists, geophysicists, engineers, and other professionals in the oil and natural gas industry can fluctuate significantly, often in correlation with natural gas and oil prices, causing periodic shortages. Historically, there have been shortages of drilling and workover rigs, pipe and other equipment as demand for rigs and equipment has increased along with the number of wells being drilled. We cannot predict whether these conditions will exist in the future and, if so, what their timing and duration will be. Such shortages could delay or cause us to incur significant expenditures that are not provided for in our capital budget, which could have a material adverse effect on our business, financial condition or results of operations.
A change in the jurisdictional characterization of some of our assets by federal, state or local regulatory agencies or a change in policy by those agencies may result in increased regulation of our assets, which may cause our revenues to decline and operating expenses to increase.
Section 1(b) of the NGA exempts natural gas gathering facilities from regulation by the FERC as a natural gas company under the NGA. Although the FERC has not made any formal determinations with respect to any of our facilities, we believe that the natural gas pipelines in our gathering systems meet the traditional tests FERC has used to establish a pipeline’s status as a gatherer not subject to regulation as a natural gas company. The distinction between FERC‑regulated transmission services and federally unregulated gathering services, however, has been the subject of substantial litigation, and the FERC determines whether facilities are gathering facilities on a case‑by‑case basis, so the classification and regulation of our gathering facilities may be subject to change based on future determinations by FERC, the courts or Congress.
Should we fail to comply with all applicable FERC administered statutes, rules, regulations and orders, we could be subject to substantial penalties and fines.
Under the EPAct of 2005, FERC has civil penalty authority under the NGA to impose penalties for current violations of up to $1 million per day for each violation and disgorgement of profits associated with any violation. While our systems have not been regulated by FERC under the NGA, FERC has adopted regulations that may subject certain of our otherwise non‑FERC jurisdictional facilities to FERC annual reporting requirements. Additional rules and legislation pertaining to those and other matters may be considered or adopted by FERC from time to time. Failure to comply with those regulations in the future could subject us to civil penalty liability.
Climate change laws and regulations restricting emissions of “greenhouse gases” could result in increased operating costs and reduced demand for the oil and natural gas that we produce while potential physical effects of climate change could disrupt our production and cause us to incur significant costs in preparing for or responding to those effects.
In response to findings that emissions of carbon dioxide, methane and other GHGs present an endangerment to public health and the environment, the EPA has adopted regulations under existing provisions of the federal Clean Air Act that, among other things, establish PSD construction and Title V operating permit reviews for certain large stationary sources. Facilities required to obtain PSD permits for their GHG emissions also will be required to meet “best available control technology” standards that will be established by the states or, in some cases, by the EPA on a case by case basis. These EPA rules could adversely affect our operations and restrict or delay our ability to obtain air permits for new or modified sources. In addition, the EPA has adopted rules requiring the monitoring and reporting of GHG emissions from specified onshore and offshore oil and gas production sources in the United States on an annual basis, which include certain of our operations. More recently, in December 2015, the EPA finalized rules added new sources to the scope of the GHG monitoring and reporting rule. These new sources include gathering and boosting facilities, as well as completions and workovers of hydraulically fractured wells. The revisions also include the addition of well identification reporting requirements for certain facilities. These changes to EPA’s GHG emissions reporting rule could result in increased compliance costs.
In addition, in August 2015, the EPA announced proposed rules that would establish new air emission controls for emissions of methane from certain equipment and processes in the oil and natural gas source category, including production, processing, transmission and storage activities. The EPA’s proposed rule package includes first-time standards to address emissions of methane from equipment and processes across the source category, including hydraulically fractured oil and natural gas well completions. In addition, the rule package would extend existing VOC standards under the EPA’s Subpart OOOO to include previously unregulated equipment within the oil and natural gas source category. More recently, in January 2016, Pennsylvania announced new rules that will require the PADEP to develop a new general permit for oil and gas exploration, development, and production facilities and liquids loading activities, requiring best available technology for equipment and processes, enhanced record-keeping, and quarterly monitoring inspections for the control of methane emissions. The PADEP also intends to issue similar methane rules for existing sources. In addition, the department has also proposed to establish Best Management Practices, including leak detection and repair, or LDAR, programs, to reduce fugitive methane emissions from production, gathering, processing, and transmission facilities. These rules have the potential to increase our compliance costs.
While Congress has from time to time considered legislation to reduce emissions of GHGs, there has not been significant activity in the form of adopted legislation to reduce GHG emissions at the federal level in recent years. In the absence of such federal climate legislation, a number of state and regional efforts have emerged that are aimed at tracking and/or reducing GHG emissions by means of cap and trade programs that typically require major sources of GHG emissions, such as electric power plants, to acquire and surrender emission allowances in return for emitting those GHGs. Although it is not possible at this time to predict how legislation or
new regulations that may be adopted to address GHG emissions would impact our business, any such future laws and regulations imposing reporting obligations on, or limiting emissions of GHGs from, our equipment and operations could require us to incur costs to reduce emissions of GHGs associated with our operations. Severe limitations on GHG emissions could also adversely affect demand for the oil and natural gas we produce. Finally, it should be noted that some scientists have concluded that increasing concentrations of GHGs in the Earth’s atmosphere may produce climate changes that have significant physical effects, such as increased frequency and severity of storms, floods and other climatic events; if any such effects were to occur, they could have an adverse effect on our exploration and production operations.
Competition in the natural gas industry is intense, making it more difficult for us to acquire properties, market natural gas and secure trained personnel.
Our ability to acquire additional prospects and to find and develop reserves in the future will depend on our ability to evaluate and select suitable properties and to consummate transactions in a highly competitive environment for acquiring properties, marketing natural gas and securing trained personnel. Also, there is substantial competition for capital available for investment in the oil and natural gas industry. Many of our competitors possess and employ financial, technical and personnel resources substantially greater than ours. Those companies may be able to pay more for productive natural gas properties and exploratory prospects and to evaluate, bid for and purchase a greater number of properties and prospects than our financial or personnel resources permit. In addition, other companies may be able to offer better compensation packages to attract and retain qualified personnel than we are able to offer. The cost to attract and retain qualified personnel may increase substantially in the future. We may not be able to compete successfully in the future in acquiring prospective reserves, developing reserves, marketing hydrocarbons, attracting and retaining quality personnel and raising additional capital, which could have a material adverse effect on our business.
Terrorist or cyber‑attacks and threats could have a material adverse effect on our business, financial condition or results of operations.
Terrorist or cyber‑attacks may significantly affect the energy industry, including our operations and those of our customers, as well as general economic conditions, consumer confidence and spending and market liquidity. Strategic targets, such as energy‑related assets, may be at greater risk of future attacks than other targets in the United States. Our insurance may not protect us against such occurrences. Consequently, it is possible that any of these occurrences, or a combination of them, could have a material adverse effect on our business, financial condition and results of operations.
The loss of senior management or technical personnel could adversely affect operations.
We depend on the services of our senior management and technical personnel. We do not maintain, nor do we plan to obtain, any insurance against the loss of any of these individuals. The loss of the services of our senior management or technical personnel, including Paul M. Rady, our Chairman and Chief Executive Officer, and Glen C. Warren, Jr., our President and Chief Financial Officer, could have a material adverse effect on our business, financial condition and results of operations.
Regulations related to the protection of wildlife adversely affect our ability to conduct drilling activities in some of the areas where we operate.
Natural gas operations in our operating areas can be adversely affected by regulations designed to protect various wildlife. The designation of previously unprotected species as threatened or endangered in areas where underlying property operations are conducted could cause us to incur increased costs arising from species protection measures or could result in constraints on our exploration and production activities. This limits our ability to operate in those areas and can intensify competition during those months for drilling rigs, oilfield equipment, services, supplies and qualified personnel, which may lead to periodic shortages. These constraints and the resulting shortages or high costs could delay our operations and materially increase our operating and capital costs.
We may be subject to risks in connection with acquisitions of properties.
The successful acquisition of producing properties requires an assessment of several factors, including:
|
·
| |
future natural gas, NGLs, and oil prices and their applicable differentials; |
|
·
| |
potential environmental and other liabilities. |
The accuracy of these assessments is inherently uncertain. In connection with these assessments, we perform a review of the subject properties that we believe to be generally consistent with industry practices. Our review will not reveal all existing or potential problems nor will it permit us to become sufficiently familiar with the properties to fully assess their deficiencies and capabilities. Inspections may not always be performed on every well, and environmental problems, such as groundwater contamination, are not necessarily observable even when an inspection is undertaken. Even when problems are identified, the seller may be unwilling or unable to provide effective contractual protection against all or part of the problems. We often are not entitled to contractual indemnification for environmental liabilities and acquire properties on an “as is” basis.
Future legislation may result in the elimination of certain U.S. federal income tax deductions currently available with respect to natural gas and oil exploration and production. Additionally, future federal or state legislation may impose new or increased taxes or fees on natural gas and oil extraction may be imposed, as a result of future legislation.
Potential legislation, if enacted into law, could make significant changes to U.S. federal and state income tax laws, including the elimination of certain key-U.S. federal income tax incentives currently available to oil and gas exploration and production companies. These changes include, but are not limited to, (i) the repeal of the percentage depletion allowance for oil and natural gas properties; (ii) the elimination of current deductions for intangible drilling and development costs; (iii) the elimination of the deduction for certain U.S. production activities; and (iv) an extension of the amortization period for certain geological and geophysical expenditures. It is unclear whether these or similar changes will be enacted and, if enacted, how soon any such changes could become effective. The passage of this legislation or any other similar changes in U.S. federal and state income tax laws could eliminate or postpone certain tax deductions that are currently available with respect to natural gas and oil exploration and development, and any such change could negatively affect our financial condition and results of operations. Moreover, President Obama has proposed, as part of the Budget of the United States Government for Fiscal Year 2017, to impose an “oil fee” of $10.25 on a per barrel equivalent of crude oil. This fee would be collected on domestically produced and imported petroleum products. The fee would be phased in evenly over five years, beginning October 1, 2016. The adoption of this, or similar proposals, could result in increased operating costs and/or reduced consumer demand for petroleum products, which in turn could affect the prices we receive for our oil.
Pennsylvania imposes an annual natural gas impact fee on natural gas and oil operators in Pennsylvania for each well drilled for a period of fifteen years. The fee is on a sliding scale set by the Public Utility Commission and is based on two factors: changes in the Consumer Price Index and the average NYMEX natural gas prices from the last day of each month. There can be no assurance that the impact fee will remain as currently structured or that new or additional taxes will not be imposed.
Ohio has previously considered, and its legislature continues to consider, proposals to increase the current severance tax imposed on natural gas or oil in Ohio. There is currently no severance tax imposed on natural gas or oil in Pennsylvania. However, it is possible that each of these states could propose and implement a new or increased severance tax in the coming years, which would negatively affect our future cash flows and financial condition.
We may be unable to make attractive acquisitions or successfully integrate acquired businesses, and any inability to do so may disrupt our business and hinder our ability to grow.
In the future we may make acquisitions of businesses that complement or expand our current business. We may not be able to identify attractive acquisition opportunities. Even if we do identify attractive acquisition opportunities, we may not be able to complete the acquisition or do so on commercially acceptable terms.
The success of any completed acquisition will depend on our ability to effectively integrate the acquired business into our existing operations. The process of integrating acquired businesses may involve unforeseen difficulties and may require a disproportionate amount of our managerial and financial resources. In addition, possible future acquisitions may be larger and for purchase prices significantly higher than those paid for earlier acquisitions. No assurance can be given that we will be able to identify suitable acquisition opportunities, negotiate acceptable terms, obtain financing for acquisitions on acceptable terms or successfully acquire identified targets. Our failure to achieve consolidation savings, to integrate the acquired businesses and assets into our existing operations successfully or to minimize any unforeseen operational difficulties could have a material adverse effect on our financial condition and results of operations.
In addition, our revolving credit facility and the indentures governing our senior notes impose certain limitations on our ability to enter into mergers or combination transactions. Our revolving credit facility and the indentures governing our senior notes also limit our ability to incur certain indebtedness, which could indirectly limit our ability to engage in acquisitions of businesses.
Item 1B. Unresolved Staff Comments
Not applicable.
Item 3. Legal Proceedings
In March 2011, we received orders for compliance from federal regulatory agencies, including the EPA relating to certain of our activities in West Virginia. The orders allege that certain of our operations at several well sites are in non-compliance with certain environmental regulations, such as unpermitted discharges of fill material into wetlands or waters of the United States that are potentially in violation of the Clean Water Act. We have responded to all pending orders and are actively cooperating with the relevant agencies. No fine or penalty relating to these matters has been proposed at this time, but we believe that these actions will result in monetary sanctions exceeding $100,000. We are unable to estimate the total amount of such monetary sanctions or costs to remediate these locations in order to bring them into compliance with applicable environmental laws and regulations. We have not, however, been required to suspend our operations at these locations to date, and management does not expect these matters to have a material adverse effect on our financial condition, results of operations, or cash flows.
In September 2014, we received a NOV from the WVDEP related to a drilling incident that occurred in Doddridge County, West Virginia. While drilling a new well, our drilling contractor came into contact with an existing well, resulting in a release of methane gas and potential temporary impacts to groundwater. In July 2015, we agreed to abatement and remediation plans with the WVDEP and paid a civil administrative penalty of $203,000 in settlement of this matter.
During the third quarter of 2015, the WVDEP issued Antero Midstream a NOV for improper installation of an engine catalyst at the startup of the North Canton Compressor Station. Antero Midstream continues to negotiate with the WVDEP to resolve this matter, but believes that it could result in monetary sanctions exceeding $100,000; however, we do not expect that any ultimate sanction will have a material adverse impact on the financial condition, results of operations, or cash flows of Antero Midstream.
The Company is the subject of two nearly identical lawsuits brought by South Jersey Gas Company and South Jersey Resources Group, LLC (collectively “SJGC”) filed on February 4, 2015 in the Superior Court of New Jersey. The lawsuits have since been consolidated into one case. SJGC are purchasers of some of the Company’s natural gas production under contracts entered into in 2011. Deliveries under the contracts began in October 2011 and the delivery obligation continues through October 2019. SJGC allege that the index prices specified in the contracts, and the index prices at which SJGC paid for deliveries from 2011 through September 2014, are no longer appropriate under the contracts because a market disruption event (as defined by the contract) has occurred and, as a result, a new index price is to be determined by the parties. The lawsuit seeks a reformation of the contracts, compensatory and punitive damages to be determined at trial, and costs and expenses of the actions. Beginning in October 2014, SJGC began paying the Company under indexes unilaterally selected by SJGC and not specified in the contract. The Company contends that no market disruption event has occurred and that SJGC has breached the contracts by failing to pay the Company based on the express price terms of the contracts. The Company further contends that jurisdiction and venue are improper in New Jersey. On March 30, 2015, the Company filed suit against SJGC in United States District Court in Colorado seeking relief for breach of contract, damages in the amounts that SJGC has short paid and continues to short pay, as well as costs of the suit. Through December 31, 2015, the Company estimates that it is owed approximately $39 million more than SJGC has paid using the indexes unilaterally selected by them.
We are party to various other legal proceedings and claims in the ordinary course of our business. We believe that certain of these matters will be covered by insurance and that the outcome of other matters will not have a material adverse effect on our consolidated financial condition, results of operations, or cash flows.
Item 4. Mine Safety Disclosures
Not applicable.
PART II
Item 5. Market for Registrant’s Common Equity, Related Stockholder Matters and Issuer Purchases of Equity Securities
Common Stock
We have one class of common shares outstanding, our par value $0.01 per share common stock. Our common stock is traded on the New York Stock Exchange under the symbol “AR.” On February 19, 2016, our common stock was held by 55 holders of record. The number of holders does not include the shareholders for whom shares are held in a “nominee” or “street” name.
The table below reflects the high and low intraday sales prices per share of the common stock on the New York Stock Exchange for each period presented.
|
|
|
|
|
|
|
|
|
|
|
|
Common Stock
|
|
|
|
|
High
|
|
Low
|
|
|
2015:
|
|
|
|
|
|
|
|
|
Quarter ended December 31, 2015
|
|
$
|
26.59
|
|
$
|
18.50
|
|
|
Quarter ended September 30, 2015
|
|
$
|
34.56
|
|
$
|
20.00
|
|
|
Quarter ended June 30, 2015
|
|
$
|
46.06
|
|
$
|
33.89
|
|
|
Quarter ended March 31, 2015
|
|
$
|
42.42
|
|
$
|
33.25
|
|
|
2014:
|
|
|
|
|
|
|
|
|
Quarter ended December 31, 2014
|
|
$
|
56.81
|
|
$
|
37.85
|
|
|
Quarter ended September 30, 2014
|
|
$
|
66.10
|
|
$
|
53.42
|
|
|
Quarter ended June 30, 2014
|
|
$
|
67.92
|
|
$
|
56.28
|
|
|
Quarter ended March 31, 2014
|
|
$
|
68.43
|
|
$
|
53.61
|
|
Issuer Purchases of Equity Securities
The following table sets forth our share repurchase activity for each period presented:
|
|
|
|
|
|
|
|
|
|
|
|
|
|
|
|
Period
|
|
Total Number of Shares Purchased
|
|
Average Price Paid Per Share
|
|
Total Number of Shares Purchased as Part of Publicly Announced Plans
|
|
Maximum Number of Shares that May Yet be Purchased Under the Plan
|
|
|
October 1, 2015 - October 31, 2015
|
|
|
2,657
|
|
$
|
23.76
|
|
|
—
|
|
|
N/A
|
|
|
November 1, 2015 - November 30, 2015
|
|
|
—
|
|
$
|
—
|
|
|
—
|
|
|
N/A
|
|
|
December 1, 2015 - December 31, 2015
|
|
|
372
|
|
$
|
20.17
|
|
|
—
|
|
|
N/A
|
|
Shares repurchased represent shares of our common stock transferred to us in order to satisfy tax withholding obligations incurred upon the vesting of restricted stock and restricted stock units held by our employees.
Dividend Restrictions
Our ability to pay dividends is governed by (i) the provisions of Delaware corporation law, (ii) our Certificate of Incorporation and Bylaws, (iii) indentures related to our 6.00% senior notes due 2020, 5.375% senior notes due 2021, 5.125% senior notes due 2022, and 5.625% senior notes due 2023, and (iv) our revolving credit facility. We have not paid or declared any dividends on our common stock. The future payment of cash dividends on our common stock, if any, is within the discretion of the Board of Directors and will depend on our earnings, capital requirements, financial condition, and other relevant factors. There is no assurance that we will pay any cash dividends on our common stock. We do not anticipate declaring or paying any cash dividends to holders of our common stock in the foreseeable future.
Stock Performance Graph
The graph below shows the cumulative total shareholder return assuming the investment of $100 on October 10, 2013 in each of Antero common stock, the S&P 500 Index, and the Dow Jones U.S. Exploration and Production Index. We believe the Dow Jones U.S. Exploration and Production Index is meaningful because it is an independent, objective view of the performance of similarly‑sized energy companies.
Comparison of Cumulative Total Returns Among Antero Resources Corporation, the S&P 500
Index, and the Dow Jones US Exploration and Production Index
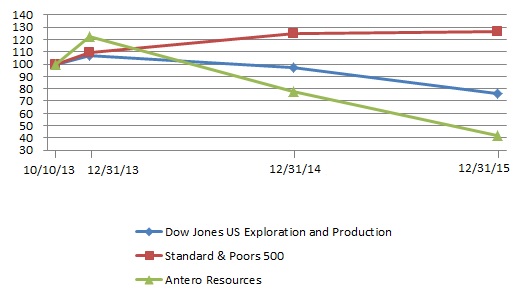
Item 6. Selected Financial Data
The following table shows our selected historical consolidated financial data, for the periods ended and as of the dates indicated, for Antero Resources Corporation and its subsidiaries (including Antero Midstream Partners LP).
The selected statement of operations data and statement of cash flows data for the years ended December 31, 2013, 2014, and 2015 and the balance sheet data as of December 31, 2014 and 2015 are derived from our audited consolidated financial statements included in Item 8 of this Annual Report on Form 10‑K. The selected statement of operations data and statement of cash flows data for the years ended December 31, 2011 and 2012 and the balance sheet data as of December 31, 2011, 2012, and 2013 are derived from our audited consolidated financial statements not included in Item 8 of this Annual Report on Form 10‑K.
The statement of operations data for all periods presented has been recast to present the results of operations from our Piceance Basin and Arkoma Basin operations in discontinued operations. The losses on the sales of these properties are also included in discontinued operations in 2012, with adjustments in 2013 and 2014 due to the resolution of certain liabilities recorded at the time of the sales and the settlement of final purchase price adjustments. The results from continuing operations reflect our remaining operations in the Appalachian Basin. No part of our general and administrative expenses or interest expense was allocated to discontinued operations.
The selected financial data presented below are qualified in their entirety by reference to, and should be read in conjunction with, “Item 7. Management’s Discussion and Analysis of Financial Condition and Results of Operations” and our consolidated financial statements and related notes included elsewhere in this report.
|
|
|
|
|
|
|
|
|
|
|
|
|
|
|
|
|
|
|
|
|
Year Ended December 31,
|
|
|
(in thousands, except per share amounts)
|
|
2011
|
|
2012
|
|
2013
|
|
2014
|
|
2015
|
|
|
Statement of operations data:
|
|
|
|
|
|
|
|
|
|
|
|
|
|
|
|
|
|
Operating revenues:
|
|
|
|
|
|
|
|
|
|
|
|
|
|
|
|
|
|
Natural gas sales
|
|
$
|
195,116
|
|
|
259,743
|
|
|
689,198
|
|
|
1,301,349
|
|
|
1,039,892
|
|
|
NGLs sales
|
|
|
—
|
|
|
3,719
|
|
|
111,663
|
|
|
328,323
|
|
|
264,483
|
|
|
Oil sales
|
|
|
173
|
|
|
1,520
|
|
|
20,584
|
|
|
107,080
|
|
|
70,753
|
|
|
Gathering, compression, and water handling and treatment
|
|
|
—
|
|
|
—
|
|
|
—
|
|
|
22,075
|
|
|
22,000
|
|
|
Marketing
|
|
|
—
|
|
|
—
|
|
|
—
|
|
|
53,604
|
|
|
176,229
|
|
|
Commodity derivative fair value gains
|
|
|
496,064
|
|
|
179,546
|
|
|
491,689
|
|
|
868,201
|
|
|
2,381,501
|
|
|
Gain on sale of assets
|
|
|
—
|
|
|
291,190
|
|
|
—
|
|
|
40,000
|
|
|
—
|
|
|
Total operating revenues
|
|
|
691,353
|
|
|
735,718
|
|
|
1,313,134
|
|
|
2,720,632
|
|
|
3,954,858
|
|
|
Operating expenses:
|
|
|
|
|
|
|
|
|
|
|
|
|
|
|
|
|
|
Lease operating
|
|
$
|
4,608
|
|
|
6,243
|
|
|
9,439
|
|
|
29,341
|
|
|
36,011
|
|
|
Gathering, compression, processing, and transportation
|
|
|
37,315
|
|
|
91,094
|
|
|
218,428
|
|
|
461,413
|
|
|
659,361
|
|
|
Production and ad valorem taxes
|
|
|
11,915
|
|
|
20,210
|
|
|
50,481
|
|
|
87,918
|
|
|
78,325
|
|
|
Marketing
|
|
|
—
|
|
|
—
|
|
|
—
|
|
|
103,435
|
|
|
299,062
|
|
|
Exploration
|
|
|
4,034
|
|
|
14,675
|
|
|
22,272
|
|
|
27,893
|
|
|
3,846
|
|
|
Impairment of unproved properties
|
|
|
4,664
|
|
|
12,070
|
|
|
10,928
|
|
|
15,198
|
|
|
104,321
|
|
|
Depletion, depreciation, and amortization
|
|
|
55,716
|
|
|
102,026
|
|
|
233,876
|
|
|
477,896
|
|
|
709,763
|
|
|
Accretion of asset retirement obligations
|
|
|
76
|
|
|
101
|
|
|
1,065
|
|
|
1,271
|
|
|
1,655
|
|
|
General and administrative (including $365,280, $112,252, and $97,877 of equity-based compensation expense in 2013, 2014, and 2015, respectively)
|
|
|
33,342
|
|
|
45,284
|
|
|
425,438
|
|
|
216,533
|
|
|
233,697
|
|
|
Contract termination and rig stacking
|
|
|
—
|
|
|
—
|
|
|
—
|
|
|
—
|
|
|
38,531
|
|
|
Loss on sale of compressor station
|
|
|
8,700
|
|
|
—
|
|
|
—
|
|
|
—
|
|
|
—
|
|
|
Total operating expenses
|
|
|
160,370
|
|
|
291,703
|
|
|
971,927
|
|
|
1,420,898
|
|
|
2,164,572
|
|
|
Operating income
|
|
|
530,983
|
|
|
444,015
|
|
|
341,207
|
|
|
1,299,734
|
|
|
1,790,286
|
|
|
Other Expenses:
|
|
|
|
|
|
|
|
|
|
|
|
|
|
|
|
|
|
Interest expense
|
|
$
|
(74,404)
|
|
|
(97,510)
|
|
|
(136,617)
|
|
|
(160,051)
|
|
|
(234,400)
|
|
|
Loss on early extinguishment of debt
|
|
|
—
|
|
|
—
|
|
|
(42,567)
|
|
|
(20,386)
|
|
|
—
|
|
|
Interest rate derivative fair value losses
|
|
|
(94)
|
|
|
—
|
|
|
—
|
|
|
—
|
|
|
—
|
|
|
Total other expenses
|
|
|
(74,498)
|
|
|
(97,510)
|
|
|
(179,184)
|
|
|
(180,437)
|
|
|
(234,400)
|
|
|
Income before income taxes and discontinued operations
|
|
|
456,485
|
|
|
346,505
|
|
|
162,023
|
|
|
1,119,297
|
|
|
1,555,886
|
|
|
Income tax expense
|
|
$
|
(185,297)
|
|
|
(121,229)
|
|
|
(186,210)
|
|
|
(445,672)
|
|
|
(575,890)
|
|
|
Income (loss) from continuing operations
|
|
|
271,188
|
|
|
225,276
|
|
|
(24,187)
|
|
|
673,625
|
|
|
979,996
|
|
|
Discontinued operations:
|
|
|
|
|
|
|
|
|
|
|
|
|
|
|
|
|
|
Income (loss) from results of operations and sale of discontinued operations, net of income tax
|
|
|
121,490
|
|
|
(510,345)
|
|
|
5,257
|
|
|
2,210
|
|
|
—
|
|
|
Net income (loss) and comprehensive income (loss) including noncontrolling interest
|
|
|
392,678
|
|
|
(285,069)
|
|
|
(18,930)
|
|
|
675,835
|
|
|
979,996
|
|
|
Net income and comprehensive income attributable to noncontrolling interest
|
|
|
—
|
|
|
—
|
|
|
—
|
|
|
2,248
|
|
|
38,632
|
|
|
Net income (loss) attributable to Antero Resources Corporation
|
|
$
|
392,678
|
|
|
(285,069)
|
|
|
(18,930)
|
|
|
673,587
|
|
|
941,364
|
|
|
|
|
|
|
|
|
|
|
|
|
|
|
|
|
|
|
|
|
Earnings (loss) per common share:
|
|
|
|
|
|
|
|
|
|
|
|
|
|
|
|
|
|
Continuing operations(1)
|
|
$
|
1.04
|
|
|
0.86
|
|
|
(0.09)
|
|
|
2.56
|
|
|
3.43
|
|
|
Discontinued operations(1)
|
|
$
|
0.46
|
|
|
(1.95)
|
|
|
0.02
|
|
|
0.01
|
|
|
—
|
|
|
Total
|
|
$
|
1.50
|
|
|
(1.09)
|
|
|
(0.07)
|
|
|
2.57
|
|
|
3.43
|
|
|
Earnings (loss) per common share—assuming dilution:
|
|
|
|
|
|
|
|
|
|
|
|
|
|
|
|
|
|
Continuing operations(1)
|
|
$
|
1.04
|
|
|
0.86
|
|
|
(0.09)
|
|
|
2.56
|
|
|
3.43
|
|
|
Discontinued operations(1)
|
|
$
|
0.46
|
|
|
(1.95)
|
|
|
0.02
|
|
|
0.01
|
|
|
—
|
|
|
Total
|
|
$
|
1.50
|
|
|
(1.09)
|
|
|
(0.07)
|
|
|
2.57
|
|
|
3.43
|
|
|
(1)
| |
Earnings (loss) per common share and earnings (loss) per common share—assuming dilution for each of the years in the three year period ended December 31, 2013 were calculated as if the shares issued in our IPO on October 16, 2013 were outstanding for the entire period. |
|
|
|
|
|
|
|
|
|
|
|
|
|
|
|
|
|
|
|
|
|
Year Ended December 31,
|
|
|
(in thousands)
|
|
2011
|
|
2012
|
|
2013
|
|
2014
|
|
2015
|
|
|
Balance sheet data (at period end):
|
|
|
|
|
|
|
|
|
|
|
|
|
|
|
|
|
|
Cash and cash equivalents
|
|
$
|
3,343
|
|
|
18,989
|
|
|
17,487
|
|
|
245,979
|
|
|
23,473
|
|
|
Other current assets
|
|
|
330,299
|
|
|
255,617
|
|
|
316,077
|
|
|
1,006,181
|
|
|
1,224,763
|
|
|
Total current assets
|
|
|
333,642
|
|
|
274,606
|
|
|
333,564
|
|
|
1,252,160
|
|
|
1,248,236
|
|
|
Natural gas properties, at cost (successful efforts method):
|
|
|
|
|
|
|
|
|
|
|
|
|
|
|
|
|
|
Unproved properties
|
|
|
834,255
|
|
|
1,243,237
|
|
|
1,513,136
|
|
|
2,060,936
|
|
|
1,996,081
|
|
|
Producing properties
|
|
|
2,497,306
|
|
|
1,682,297
|
|
|
3,621,672
|
|
|
6,515,221
|
|
|
8,211,106
|
|
|
Water handling and treatment systems
|
|
|
—
|
|
|
6,835
|
|
|
231,684
|
|
|
421,012
|
|
|
565,616
|
|
|
Gathering systems and facilities
|
|
|
142,241
|
|
|
168,930
|
|
|
584,626
|
|
|
1,197,239
|
|
|
1,502,396
|
|
|
Other property and equipment
|
|
|
8,314
|
|
|
9,517
|
|
|
15,757
|
|
|
37,687
|
|
|
46,415
|
|
|
|
|
|
3,482,116
|
|
|
3,110,816
|
|
|
5,966,875
|
|
|
10,232,095
|
|
|
12,321,614
|
|
|
Less accumulated depletion, depreciation, and amortization
|
|
|
(601,702)
|
|
|
(173,343)
|
|
|
(407,219)
|
|
|
(879,643)
|
|
|
(1,589,372)
|
|
|
Property and equipment, net
|
|
|
2,880,414
|
|
|
2,937,473
|
|
|
5,559,656
|
|
|
9,352,452
|
|
|
10,732,242
|
|
|
Other assets
|
|
|
574,744
|
|
|
406,714
|
|
|
720,361
|
|
|
968,883
|
|
|
2,174,746
|
|
|
Total assets
|
|
$
|
3,788,800
|
|
|
3,618,793
|
|
|
6,613,581
|
|
|
11,573,495
|
|
|
14,155,224
|
|
|
|
|
|
|
|
|
|
|
|
|
|
|
|
|
|
|
|
|
Current liabilities
|
|
$
|
179,750
|
|
|
313,676
|
|
|
553,038
|
|
|
894,732
|
|
|
707,270
|
|
|
Long-term indebtedness
|
|
|
1,317,330
|
|
|
1,444,058
|
|
|
2,078,999
|
|
|
4,362,550
|
|
|
4,708,513
|
|
|
Other long-term liabilities
|
|
|
332,914
|
|
|
187,322
|
|
|
382,884
|
|
|
842,383
|
|
|
1,452,763
|
|
|
Total equity
|
|
|
1,958,806
|
|
|
1,673,737
|
|
|
3,598,660
|
|
|
5,473,830
|
|
|
7,286,678
|
|
|
Total liabilities and equity
|
|
$
|
3,788,800
|
|
|
3,618,793
|
|
|
6,613,581
|
|
|
11,573,495
|
|
|
14,155,224
|
|
|
Other financial data:
|
|
|
|
|
|
|
|
|
|
|
|
|
|
|
|
|
|
Adjusted EBITDAX from continuing operations
|
|
$
|
160,259
|
|
|
284,710
|
|
|
649,358
|
|
|
1,164,015
|
|
|
1,221,422
|
|
|
Adjusted EBITDAX from discontinued operations
|
|
$
|
180,562
|
|
|
149,605
|
|
|
—
|
|
|
—
|
|
|
—
|
|
|
Total Adjusted EBITDAX
|
|
$
|
340,821
|
|
|
434,315
|
|
|
649,358
|
|
|
1,164,015
|
|
|
1,221,422
|
|
|
Net cash provided by operating activities
|
|
$
|
266,307
|
|
|
332,255
|
|
|
534,707
|
|
|
998,121
|
|
|
1,006,381
|
|
|
Net cash used in investing activities
|
|
$
|
(901,249)
|
|
|
(463,491)
|
|
|
(2,673,592)
|
|
|
(4,089,650)
|
|
|
(2,298,159)
|
|
|
Net cash provided by financing activities
|
|
$
|
629,297
|
|
|
146,882
|
|
|
2,137,383
|
|
|
3,320,021
|
|
|
1,069,272
|
|
|
Capital expenditures
|
|
$
|
903,422
|
|
|
1,682,549
|
|
|
2,671,573
|
|
|
4,086,568
|
|
|
2,347,909
|
|
“Adjusted EBITDAX” is a non-GAAP financial measure that we define as net income (loss), including noncontrolling interests, before interest expense, interest income, derivative fair value gains or losses (excluding net cash receipts or payments on derivative instruments included in derivative fair value gains or losses), taxes, impairments, depletion, depreciation, amortization, and accretion, exploration expense, franchise taxes, equity-based compensation, loss on early extinguishment of debt, contract termination and rig stacking costs, and gain or loss on sale of assets. “Adjusted EBITDAX,” as used and defined by us, may not be comparable to similarly titled measures employed by other companies and is not a measure of performance calculated in accordance with GAAP. Adjusted EBITDAX should not be considered in isolation or as a substitute for operating income, net income or loss, cash flows provided by operating, investing, and financing activities, or other income or cash flow statement data prepared in accordance with GAAP. Adjusted EBITDAX provides no information regarding a company’s capital structure, borrowings, interest costs, capital expenditures, and working capital movement or tax position. Adjusted EBITDAX does not represent funds available for discretionary use because those funds may be required for debt service, capital expenditures, working capital, income taxes, franchise taxes, exploration expenses, and other commitments and obligations. However, our management team believes Adjusted EBITDAX is useful to an investor in evaluating our financial performance because this measure:
|
·
| |
is widely used by investors in the oil and natural gas industry to measure a company’s operating performance without regard to items excluded from the calculation of such term, which can vary substantially from company to company depending upon accounting methods and book value of assets, capital structure and the method by which assets were acquired, among other factors; |
|
·
| |
helps investors to more meaningfully evaluate and compare the results of our operations from period to period by removing the effect of our capital structure from our operating structure; and |
|
·
| |
is used by our management team for various purposes, including as a measure of operating performance, in presentations to our board of directors, as a basis for strategic planning and forecasting. Adjusted EBITDAX for Antero Resources Corporation on a standalone basis (excluding the operations of Antero Midstream) is used by our lenders pursuant to covenants under our revolving credit facility and the indentures governing our senior notes. |
There are significant limitations to using Adjusted EBITDAX as a measure of performance, including the inability to analyze the effects of certain recurring and non‑recurring items that materially affect our net income or loss, the lack of comparability of results of operations of different companies, and the different methods of calculating Adjusted EBITDAX reported by different
companies. The following table represents a reconciliation of our net income (loss) from continuing operations to Adjusted EBITDAX from continuing operations, including noncontrolling interests, a reconciliation of our net income (loss) from discontinued operations to Adjusted EBITDAX from discontinued operations, and a reconciliation of our total Adjusted EBITDAX to net cash provided by operating activities per our consolidated statements of cash flows, in each case, for the periods presented:
|
|
|
|
|
|
|
|
|
|
|
|
|
|
|
|
|
|
|
|
|
Year ended December 31,
|
|
|
(in thousands)
|
|
2011
|
|
2012
|
|
2013
|
|
2014
|
|
2015
|
|
|
Net income (loss) from continuing operations including noncontrolling interest
|
|
$
|
271,188
|
|
|
225,276
|
|
|
(24,187)
|
|
|
673,625
|
|
|
979,996
|
|
|
Commodity derivative fair value gains(1)
|
|
|
(496,064)
|
|
|
(179,546)
|
|
|
(491,689)
|
|
|
(868,201)
|
|
|
(2,381,501)
|
|
|
Gains on settled derivatives(1)
|
|
|
49,944
|
|
|
178,491
|
|
|
163,570
|
|
|
135,784
|
|
|
856,572
|
|
|
Loss (gain) on sale of assets
|
|
|
8,700
|
|
|
(291,190)
|
|
|
—
|
|
|
(40,000)
|
|
|
—
|
|
|
Interest expense
|
|
|
74,498
|
|
|
97,510
|
|
|
136,617
|
|
|
160,051
|
|
|
234,400
|
|
|
Loss on early extinguishment of debt
|
|
|
—
|
|
|
—
|
|
|
42,567
|
|
|
20,386
|
|
|
—
|
|
|
Income tax expense
|
|
|
185,297
|
|
|
121,229
|
|
|
186,210
|
|
|
445,672
|
|
|
575,890
|
|
|
Depletion, depreciation, amortization, and accretion
|
|
|
55,792
|
|
|
102,127
|
|
|
234,941
|
|
|
479,167
|
|
|
711,418
|
|
|
Impairment of unproved properties
|
|
|
4,664
|
|
|
12,070
|
|
|
10,928
|
|
|
15,198
|
|
|
104,321
|
|
|
Exploration expense
|
|
|
4,034
|
|
|
14,675
|
|
|
22,272
|
|
|
27,893
|
|
|
3,846
|
|
|
Equity-based compensation expense
|
|
|
—
|
|
|
—
|
|
|
365,280
|
|
|
112,252
|
|
|
97,877
|
|
|
State franchise taxes
|
|
|
2,206
|
|
|
4,068
|
|
|
2,849
|
|
|
2,188
|
|
|
72
|
|
|
Contract termination and rig stacking
|
|
|
—
|
|
|
—
|
|
|
—
|
|
|
—
|
|
|
38,531
|
|
|
Adjusted EBITDAX from continuing operations
|
|
|
160,259
|
|
|
284,710
|
|
|
649,358
|
|
|
1,164,015
|
|
|
1,221,422
|
|
|
Net income (loss) from discontinued operations
|
|
|
121,490
|
|
|
(510,345)
|
|
|
5,257
|
|
|
2,210
|
|
|
—
|
|
|
Commodity derivative fair value gains
|
|
|
(180,130)
|
|
|
(46,358)
|
|
|
—
|
|
|
—
|
|
|
—
|
|
|
Gains on settled derivatives
|
|
|
66,654
|
|
|
92,166
|
|
|
—
|
|
|
—
|
|
|
—
|
|
|
Loss (gain) on sale of assets
|
|
|
—
|
|
|
795,945
|
|
|
(8,506)
|
|
|
(3,564)
|
|
|
—
|
|
|
Income tax expense (benefit)
|
|
|
45,155
|
|
|
(272,553)
|
|
|
3,249
|
|
|
1,354
|
|
|
—
|
|
|
Depletion, depreciation, amortization, and accretion
|
|
|
115,164
|
|
|
89,124
|
|
|
—
|
|
|
—
|
|
|
—
|
|
|
Impairment of unproved properties
|
|
|
6,387
|
|
|
962
|
|
|
—
|
|
|
—
|
|
|
—
|
|
|
Exploration expense
|
|
|
5,842
|
|
|
664
|
|
|
—
|
|
|
—
|
|
|
—
|
|
|
Adjusted EBITDAX from discontinued operations
|
|
|
180,562
|
|
|
149,605
|
|
|
—
|
|
|
—
|
|
|
—
|
|
|
Total Adjusted EBITDAX
|
|
|
340,821
|
|
|
434,315
|
|
|
649,358
|
|
|
1,164,015
|
|
|
1,221,422
|
|
|
Interest expense
|
|
|
(74,498)
|
|
|
(97,510)
|
|
|
(136,617)
|
|
|
(160,051)
|
|
|
(234,400)
|
|
|
Exploration expense
|
|
|
(9,876)
|
|
|
(15,339)
|
|
|
(22,272)
|
|
|
(27,893)
|
|
|
(3,846)
|
|
|
Changes in current assets and liabilities
|
|
|
8,309
|
|
|
9,887
|
|
|
41,914
|
|
|
17,805
|
|
|
30,067
|
|
|
State franchise taxes
|
|
|
(2,206)
|
|
|
(4,068)
|
|
|
(2,849)
|
|
|
(2,188)
|
|
|
(72)
|
|
|
Other noncash items
|
|
|
3,757
|
|
|
4,970
|
|
|
5,173
|
|
|
6,433
|
|
|
(6,790)
|
|
|
Net cash provided by operating activities
|
|
$
|
266,307
|
|
|
332,255
|
|
|
534,707
|
|
|
998,121
|
|
|
1,006,381
|
|
|
(1)
| |
The adjustments for the derivative fair value gains and gains on settled derivatives have the effect of adjusting net income (loss) from operations for changes in the fair value of unsettled derivatives, which are recognized at the end of each accounting period. As a result, derivate gains included in the calculation of Adjusted EBITDAX reflect derivatives which settled during the period. |
Item 7. Management’s Discussion and Analysis of Financial Condition and Results of Operations
The following discussion and analysis of our financial condition and results of operations should be read in conjunction with our consolidated financial statements and related notes included elsewhere in this report. The following discussion contains “forward‑looking statements” that reflect our future plans, estimates, beliefs and expected performance. We caution that assumptions, expectations, projections, intentions, or beliefs about future events may, and often do, vary from actual results and the differences can be material. Some of the key factors that could cause actual results to vary from our expectations include changes in natural gas, NGLs and oil prices, the timing of planned capital expenditures, our ability to fund our development programs, availability of acquisitions, uncertainties in estimating proved reserves and forecasting production results, operational factors affecting the commencement or maintenance of producing wells, the condition of the capital markets generally, as well as our ability to access them, and uncertainties regarding environmental regulations or litigation and other legal or regulatory developments affecting our business, as well as those factors discussed below, all of which are difficult to predict. In light of these risks, uncertainties and assumptions, the forward‑looking events discussed may not occur. See “Cautionary Statement Regarding Forward‑Looking Statements.” Also, see the risk factors and other cautionary statements described under the heading “Item 1A. Risk Factors.” We do not undertake any obligation to publicly update any forward‑looking statements except as otherwise required by applicable law.
In this section, references to “Antero Resources,” “the Company,” “we,” “us,” and “our” refer to Antero Resources Corporation and its subsidiaries, unless otherwise indicated or the context otherwise requires.
Our Company
Antero Resources Corporation is an independent oil and natural gas company engaged in the exploration, development and acquisition of natural gas, NGLs, and oil properties located in the Appalachian Basin. We focus on unconventional reservoirs, which can generally be characterized as fractured shale formations. Our management team has worked together for many years and has a successful track record of reserve and production growth as well as significant expertise in unconventional resource plays. Our strategy is to leverage our team’s experience delineating and developing natural gas resource plays to profitably grow our reserves and production, primarily on our existing multi-year inventory of drilling locations.
We have assembled a portfolio of long-lived properties that are characterized by what we believe to be low geologic risk and repeatability. Our drilling opportunities are focused in the Marcellus Shale and Utica Shale of the Appalachian Basin. As of December 31, 2015, we held approximately 422,000 net acres in the southwestern core of the Marcellus Shale and approximately 147,000 net acres in the core of the Utica Shale. In addition, we estimate that approximately 191,000 net acres of our Marcellus Shale leasehold are prospective for the slightly shallower Upper Devonian Shale. Finally, we own the deep rights on approximately 188,000 net acres of our Marcellus Shale leasehold that we believe are prospective for the dry gas Utica Shale.
As of December 31, 2015, our estimated proved reserves were approximately 13.2 Tcfe, consisting of 9.5 Tcf of natural gas, 587 MMBbl of NGLs, and 26 MMBbl of oil. This represents a 4% increase from December 31, 2014. These reserve estimates have been prepared by our internal reserve engineers and management and audited by our independent reserve engineers. As of December 31, 2015, we had approximately 3,719 potential proved and unproved horizontal well locations on our existing leasehold acreage.
We operate in the following industry segments: (i) the exploration, development and production of natural gas, NGLs, and oil; (ii) gathering and compression; (iii) water handling and treatment; and (iv) marketing of excess firm transportation capacity. All of our operations are conducted in the United States.
Energy Industry Environment
In late 2014, global energy commodity prices declined precipitously as a result of several factors, including an increase in worldwide commodity supplies, a stronger U.S. dollar, relatively mild weather in large portions of the U.S. during winter months, and strong competition among oil producing countries for market share. These events continued into 2015 and early 2016 and, along with slower economic growth in China, have led to the further suppression of commodity prices. Spot prices for WTI declined from approximately $106.00 per Bbl in June 2014 to less than $50.00 per Bbl in January 2015, and declined further to less than $30.00 per Bbl in January 2016. Spot prices for Henry Hub natural gas declined from approximately $4.40 per MMBtu in January 2014 to $3.00 per MMBtu in January 2015, and declined further to less than $1.80 per MMBtu for a brief period in December 2015. Spot prices for propane, which is the largest portion of our NGLs sales, declined from approximately $1.55 per gallon in January 2014 to less than $0.50 per gallon in January 2015, and declined further to less than $0.35 per gallon in January 2016.
In response to these market conditions and concerns about access to capital markets, many U.S. exploration and development companies significantly reduced their capital spending in 2015. Our capital spending for drilling, completions, and land for 2015 was $1.8 billion, a reduction of approximately 44% from our 2014 capital expenditures. In conjunction with the reduction in our capital expenditures during 2015, we deferred the completion of 50 wells.
Our capital budget for drilling, completions, and land for 2016 is $1.4 billion, a 24% reduction from our 2015 capital expenditures. We plan to operate an average of 7 drilling rigs in 2016 as compared to an average of 14 rigs in 2015, and we plan to complete 115 horizontal wells in the Marcellus and Utica Shales in 2016 as compared to 130 in 2015. We believe that our 2016 capital budget will be fully funded through operating cash flow and available borrowing capacity under our revolving credit facility or capital market transactions. We will continue to monitor commodity prices and may revise the capital budget if conditions warrant.
We evaluate the carrying amount of our proved natural gas, NGLs, and oil properties for impairment on a field-by-field basis whenever events or changes in circumstances (such as the decline in commodity prices during 2015) indicate that a property’s carrying amount may not be recoverable. If the carrying amount exceeded the estimated undiscounted future cash flows (measured using strip prices at the end of a quarter), we would further evaluate our proved properties and record an impairment charge if the carrying amount of our proved properties exceeded the estimated fair value of the properties. Due to the current commodity price environment, we compared the carrying values of our proved properties to estimated future cash flows. As estimated future cash flows remained higher than the carrying value of our properties at December 31, 2015, we did not further evaluate our proved properties for impairment. See “—Critical Accounting Policies and Estimates” for a discussion of such evaluation.
Source of Our Revenues
Our revenues are primarily derived from the sale of natural gas and oil production, as well as the sale of NGLs that are extracted from our natural gas during processing. Our production is entirely from within the continental United States. During 2015, our revenues from production were comprised of approximately 76% from the sale of natural gas and 24% from the sale of NGLs and oil. Natural gas, NGLs, and oil prices are inherently volatile and are influenced by many factors outside of our control. All of our production is derived from natural gas wells, some of which also produce NGLs, after processing, and limited quantities of oil. To achieve more predictable cash flows and to reduce our exposure to downward price fluctuations, we utilize derivative instruments to hedge future sales prices on a significant portion of our production.
We currently enter into fixed price natural gas and propane swap contracts in which we receive or pay the difference between a fixed price and the variable market price received. We enter into these contracts in order to reduce the variability in cash flows associated with our expected future production. In the past, we have also used fixed-price oil swaps. In addition, we also use basis swap contracts in order to hedge the difference between the New York Mercantile Exchange (“NYMEX”) index price and a local index price. At the end of each accounting period, we estimate the fair value of these swaps and, because we have not elected hedge accounting, we recognize changes in the fair value of these derivative instruments in earnings. We expect continued volatility in the prices we receive for our production and the fair value of our derivative instruments.
Revenues from our gathering and compression and water handling and treatment operations are primarily derived from intersegment transactions for services Antero Midstream provides to our exploration and production operations. The portion of such fees shown in our consolidated financial statements represent amounts charged to outside working interest owners in Company-operated wells, as well as fees charged to other third parties for water handling and treatment services provided by the Company or usage of Antero Midstream’s gathering pipelines.
Marketing revenues are primarily derived from activities to purchase and sell third-party natural gas and NGLs and to market excess firm transportation capacity to third parties.
Principal Components of Our Cost Structure
|
·
| |
Lease operating expenses. These are the day to day operating costs incurred to maintain production of our natural gas, NGLs, and oil. Such costs include labor-related costs to monitor producing wells, produced water treatment and disposal, maintenance, repairs, and workover expenses. Cost levels for these expenses can vary based on supply and demand for oilfield services, and activity levels. |
|
·
| |
Gathering, compression, processing and transportation. These are costs incurred to bring natural gas, NGLs, and oil to the market. Such costs include the costs to operate and maintain our low- and high-pressure gathering and compression |
systems held by Antero Midstream, as well as fees paid to third parties who operate low‑ and high‑pressure gathering systems that transport our gas. They also include costs to process and extract NGLs from our produced gas and to transport our NGLs and oil to market. We often enter into fixed price long‑term contracts that secure transportation and processing capacity which may include minimum volume commitments, the cost for which is included in these expenses to the extent that they are not excess capacity. Costs associated with excess capacity are included in marketing expenses. |
|
·
| |
Production and ad valorem taxes. Production and ad valorem taxes consist of severance and ad valorem taxes. Severance taxes are paid on produced natural gas and oil based on a percentage of realized prices (not hedged prices) and at fixed per-unit rates established by federal, state or local taxing authorities. Ad valorem taxes are paid based on the value of our property and equipment in service, as well as the value of our reserves. |
|
·
| |
Marketing expenses. In 2014, we began to purchase and sell third-party natural gas and NGLs and to market our excess firm transportation capacity in order to utilize this excess capacity. Marketing costs include the cost of purchased third-party natural gas and NGLs. We also classify firm transportation costs related to capacity contracted for in advance of having sufficient production and infrastructure to fully utilize the capacity (excess capacity) as marketing expenses since we are marketing this excess capacity to third parties. We enter into long-term firm transportation agreements for a significant part of our current and expected future production in order to secure capacity on major pipelines. |
|
·
| |
Exploration expense. These are geological and geophysical costs and include seismic costs, costs related to unsuccessful leasing efforts, and costs of unsuccessful exploratory dry holes. We have not recorded any costs related to exploratory dry holes in the three years ended December 31, 2015. |
|
·
| |
Impairment of unproved and proved properties. These costs include unproved property impairment and costs associated with lease expirations. We would also record impairment charges for proved properties if the carrying values were to exceed estimated future cash flows. Through December 31, 2015, we have not recorded any impairment for proved properties. |
|
·
| |
Depletion, depreciation, and amortization. Depletion, depreciation, and amortization, or DD&A, includes the systematic expensing of the capitalized costs incurred to acquire, explore, and develop natural gas, NGLs, and oil. As a “successful efforts” company, we capitalize all costs associated with our acquisition and development efforts and all successful exploration efforts, and allocate these costs to each unit of production using the units of production method. |
|
·
| |
General and administrative expense. These costs include overhead, including payroll and benefits for our staff, costs of maintaining our headquarters, costs of managing our production and development operations, franchise taxes, audit and other professional fees, and legal compliance expenses. General and administrative expense also includes noncash equity-based compensation expense (see note 8 to the consolidated financial statements included elsewhere in this report). |
|
·
| |
Interest expense. We finance a portion of our capital expenditures, working capital requirements and acquisitions with borrowings under our revolving credit facilities, which have variable rates of interest based on LIBOR or the prime rate. As a result, we incur substantial interest expense that is affected by both fluctuations in interest rates and our financing decisions. At December 31, 2015 we had a fixed interest rate of 6.00% on our senior notes due 2020 having a principal balance of $525 million, a fixed interest rate of 5.375% on our senior notes due 2021 having a principal balance of $1 billion, a fixed interest rate of 5.125% on our senior notes due 2022 having a principal balance of $1.1 billion, and a fixed interest rate of 5.625% on our senior notes due 2023 having a principal balance of $750 million. We expect to continue to incur significant interest expense as we continue to grow our operations. |
|
·
| |
Income tax expense. We are subject to state and federal income taxes, but are currently not in a tax paying position for regular federal income taxes, primarily due to the differences in the tax and financial statement treatment of oil and gas properties, and the deferral of unsettled commodity hedge gains for tax purposes until they are settled in an exchange of cash. We do pay some state income or franchise taxes where state income or franchise taxes are determined on a basis other than income. We have recorded deferred income tax expense to the extent our deferred tax liabilities exceed our deferred tax assets. Our deferred tax assets and liabilities result from temporary differences between tax and financial statement income primarily from derivatives, oil and gas properties, and net operating loss carryforwards. At December 31, 2015, we had approximately $1.4 billion of U.S. federal net operating loss carryforwards (NOLs) and approximately $1.2 billion of state NOLs, which expire from 2024 through 2035. We recorded valuation allowances for deferred tax assets at December 31, |
2015 of approximately $27 million related to state loss carryforwards for which we do not believe we will realize a benefit. The amount of deferred tax assets considered realizable, however, could change in the near term as we generate taxable income or as estimates of future taxable income are reduced. |
Results of Operations
Year Ended December 31, 2014 Compared to Year Ended December 31, 2015
The Company has four operating segments: (1) the exploration, development, and production of natural gas, NGLs, and oil; (2) gathering and compression; (3) water handling and treatment; and (4) marketing of excess firm transportation capacity. Revenues from the gathering and compression and water handling and treatment operations are primarily derived from intersegment transactions for services provided to our exploration and production operations. Marketing revenues are primarily derived from activities to purchase and sell third-party natural gas and NGLs and to market excess firm transportation capacity to third parties. The operating results and assets of the Company’s reportable segments were as follows for the years ended December 31, 2014 and 2015 (in thousands):
|
|
|
|
|
|
|
|
|
|
|
|
|
|
|
|
|
|
|
Exploration
and
production
|
|
Gathering and
compression
|
|
Water
handling and
treatment
|
|
Marketing
|
|
Elimination of
intersegment
transactions
|
|
Consolidated
total
|
|
|
Year ended December 31, 2014:
|
|
|
|
|
|
|
|
|
|
|
|
|
|
|
|
Sales and revenues:
|
|
|
|
|
|
|
|
|
|
|
|
|
|
|
|
Third-party
|
|
$
|
2,644,953
|
|
6,810
|
|
15,265
|
|
53,604
|
|
—
|
|
2,720,632
|
|
|
Intersegment
|
|
|
195
|
|
88,936
|
|
156,660
|
|
—
|
|
(245,791)
|
|
—
|
|
|
Total
|
|
$
|
2,645,148
|
|
95,746
|
|
171,925
|
|
53,604
|
|
(245,791)
|
|
2,720,632
|
|
|
|
|
|
|
|
|
|
|
|
|
|
|
|
|
|
|
Operating expenses:
|
|
|
|
|
|
|
|
|
|
|
|
|
|
|
|
Lease operating
|
|
$
|
28,041
|
|
—
|
|
34,737
|
|
—
|
|
(33,437)
|
|
29,341
|
|
|
Gathering, compression, processing, and transportation
|
|
|
536,879
|
|
13,497
|
|
—
|
|
—
|
|
(88,963)
|
|
461,413
|
|
|
Depletion, depreciation, and amortization
|
|
|
424,684
|
|
36,972
|
|
16,240
|
|
—
|
|
—
|
|
477,896
|
|
|
General and administrative expense (before equity-based compensation)
|
|
|
85,701
|
|
13,416
|
|
5,332
|
|
—
|
|
(168)
|
|
104,281
|
|
|
Equity-based compensation expense
|
|
|
100,634
|
|
8,619
|
|
2,999
|
|
—
|
|
—
|
|
112,252
|
|
|
Other operating expenses
|
|
|
128,419
|
|
1,973
|
|
1,888
|
|
103,435
|
|
—
|
|
235,715
|
|
|
Total
|
|
|
1,304,358
|
|
74,477
|
|
61,196
|
|
103,435
|
|
(122,568)
|
|
1,420,898
|
|
|
Operating income (loss)
|
|
$
|
1,340,790
|
|
21,269
|
|
110,729
|
|
(49,831)
|
|
(123,223)
|
|
1,299,734
|
|
|
|
|
|
|
|
|
|
|
|
|
|
|
|
|
|
|
|
|
Exploration
and
production
|
|
Gathering and
compression
|
|
Water
handling and
treatment
|
|
Marketing
|
|
Elimination of
intersegment
transactions
|
|
Consolidated
total
|
|
|
Year ended December 31, 2015:
|
|
|
|
|
|
|
|
|
|
|
|
|
|
|
|
Sales and revenues:
|
|
|
|
|
|
|
|
|
|
|
|
|
|
|
|
Third-party
|
|
$
|
3,756,629
|
|
12,353
|
|
9,647
|
|
176,229
|
|
—
|
|
3,954,858
|
|
|
Intersegment
|
|
|
4,795
|
|
218,239
|
|
147,085
|
|
—
|
|
(370,119)
|
|
—
|
|
|
Total
|
|
$
|
3,761,424
|
|
230,592
|
|
156,732
|
|
176,229
|
|
(370,119)
|
|
3,954,858
|
|
|
|
|
|
|
|
|
|
|
|
|
|
|
|
|
|
|
Operating expenses:
|
|
|
|
|
|
|
|
|
|
|
|
|
|
|
|
Lease operating
|
|
$
|
35,552
|
|
—
|
|
49,859
|
|
—
|
|
(49,400)
|
|
36,011
|
|
|
Gathering, compression, processing, and transportation
|
|
|
852,573
|
|
25,305
|
|
—
|
|
—
|
|
(218,517)
|
|
659,361
|
|
|
Depletion, depreciation, and amortization
|
|
|
622,379
|
|
61,552
|
|
25,832
|
|
—
|
|
—
|
|
709,763
|
|
|
General and administrative expense (before equity-based compensation)
|
|
|
108,268
|
|
22,608
|
|
6,128
|
|
—
|
|
(1,184)
|
|
135,820
|
|
|
Equity-based compensation expense
|
|
|
75,407
|
|
17,840
|
|
4,630
|
|
—
|
|
—
|
|
97,877
|
|
|
Other operating expenses
|
|
|
222,990
|
|
3,811
|
|
3,210
|
|
299,062
|
|
(3,333)
|
|
525,740
|
|
|
Total
|
|
|
1,917,169
|
|
131,116
|
|
89,659
|
|
299,062
|
|
(272,434)
|
|
2,164,572
|
|
|
Operating income (loss)
|
|
$
|
1,844,255
|
|
99,476
|
|
67,073
|
|
(122,833)
|
|
(97,685)
|
|
1,790,286
|
|
The following tables set forth selected operating data for the year ended December 31, 2014 compared to the year ended December 31, 2015:
|
|
|
|
|
|
|
|
|
|
|
|
|
|
|
|
|
Year ended December 31,
|
|
Amount of
Increase
|
|
Percent
|
|
|
(in thousands)
|
|
2014
|
|
2015
|
|
(Decrease)
|
|
Change
|
|
|
Operating revenues:
|
|
|
|
|
|
|
|
|
|
|
|
|
|
Natural gas sales
|
|
$
|
1,301,349
|
|
$
|
1,039,892
|
|
$
|
(261,457)
|
|
(20)
|
%
|
|
NGLs sales
|
|
|
328,323
|
|
|
264,483
|
|
|
(63,840)
|
|
(19)
|
%
|
|
Oil sales
|
|
|
107,080
|
|
|
70,753
|
|
|
(36,327)
|
|
(34)
|
%
|
|
Gathering, compression, and water handling and treatment
|
|
|
22,075
|
|
|
22,000
|
|
|
(75)
|
|
—
|
%
|
|
Marketing
|
|
|
53,604
|
|
|
176,229
|
|
|
122,625
|
|
229
|
%
|
|
Commodity derivative fair value gains
|
|
|
868,201
|
|
|
2,381,501
|
|
|
1,513,300
|
|
174
|
%
|
|
Gain on sale of gathering system
|
|
|
40,000
|
|
|
—
|
|
|
(40,000)
|
|
*
|
|
|
Total operating revenues
|
|
|
2,720,632
|
|
|
3,954,858
|
|
|
1,234,226
|
|
45
|
%
|
|
Operating expenses:
|
|
|
|
|
|
|
|
|
|
|
|
|
|
Lease operating
|
|
|
29,341
|
|
|
36,011
|
|
|
6,670
|
|
23
|
%
|
|
Gathering, compression, processing, and transportation
|
|
|
461,413
|
|
|
659,361
|
|
|
197,948
|
|
43
|
%
|
|
Production and ad valorem taxes
|
|
|
87,918
|
|
|
78,325
|
|
|
(9,593)
|
|
(11)
|
%
|
|
Marketing
|
|
|
103,435
|
|
|
299,062
|
|
|
195,627
|
|
189
|
%
|
|
Exploration
|
|
|
27,893
|
|
|
3,846
|
|
|
(24,047)
|
|
(86)
|
%
|
|
Impairment of unproved properties
|
|
|
15,198
|
|
|
104,321
|
|
|
89,123
|
|
586
|
%
|
|
Depletion, depreciation, and amortization
|
|
|
477,896
|
|
|
709,763
|
|
|
231,867
|
|
49
|
%
|
|
Accretion of asset retirement obligations
|
|
|
1,271
|
|
|
1,655
|
|
|
384
|
|
30
|
%
|
|
General and administrative (before equity-based compensation)
|
|
|
104,281
|
|
|
135,820
|
|
|
31,539
|
|
30
|
%
|
|
Equity-based compensation
|
|
|
112,252
|
|
|
97,877
|
|
|
(14,375)
|
|
(13)
|
%
|
|
Contract termination and rig stacking
|
|
|
—
|
|
|
38,531
|
|
|
38,531
|
|
*
|
|
|
Total operating expenses
|
|
|
1,420,898
|
|
|
2,164,572
|
|
|
743,674
|
|
52
|
%
|
|
Operating income
|
|
|
1,299,734
|
|
|
1,790,286
|
|
|
490,552
|
|
38
|
%
|
|
|
|
|
|
|
|
|
|
|
|
|
|
|
|
Other Expenses:
|
|
|
|
|
|
|
|
|
|
|
|
|
|
Interest expense
|
|
|
(160,051)
|
|
|
(234,400)
|
|
|
(74,349)
|
|
46
|
%
|
|
Loss on early extinguishment of debt
|
|
|
(20,386)
|
|
|
—
|
|
|
20,386
|
|
*
|
|
|
Total other expenses
|
|
|
(180,437)
|
|
|
(234,400)
|
|
|
(53,963)
|
|
30
|
%
|
|
Income from continuing operations before income taxes and discontinued operations
|
|
|
1,119,297
|
|
|
1,555,886
|
|
|
436,589
|
|
39
|
%
|
|
Income tax expense
|
|
|
(445,672)
|
|
|
(575,890)
|
|
|
(130,218)
|
|
29
|
%
|
|
Income from continuing operations
|
|
|
673,625
|
|
|
979,996
|
|
|
306,371
|
|
45
|
%
|
|
Income from discontinued operations
|
|
|
2,210
|
|
|
—
|
|
|
(2,210)
|
|
*
|
|
|
Net income and comprehensive income including noncontrolling interest
|
|
|
675,835
|
|
|
979,996
|
|
|
304,161
|
|
45
|
%
|
|
Net income and comprehensive income attributable to noncontrolling interest
|
|
|
2,248
|
|
|
38,632
|
|
|
36,384
|
|
1,619
|
%
|
|
Net income and comprehensive income attributable to Antero Resources Corporation
|
|
$
|
673,587
|
|
$
|
941,364
|
|
$
|
267,777
|
|
40
|
%
|
|
|
|
|
|
|
|
|
|
|
|
|
|
|
|
Adjusted EBITDAX (1)
|
|
$
|
1,164,015
|
|
$
|
1,221,422
|
|
$
|
57,407
|
|
5
|
%
|
|
(1)
| |
See “Item 6. Selected Financial Data” included elsewhere in this report for a definition of Adjusted EBITDAX (a non‑GAAP measure) and a reconciliation of Adjusted EBITDAX to net income from continuing operations including noncontrolling interest and net cash provided by operating activities. |
*Not meaningful or applicable.
|
|
|
|
|
|
|
|
|
|
|
|
|
|
|
|
|
Year ended December 31,
|
|
Amount of
Increase
|
|
Percent
|
|
|
|
|
2014
|
|
2015
|
|
(Decrease)
|
|
Change
|
|
|
Production data:
|
|
|
|
|
|
|
|
|
|
|
|
|
|
Natural gas (Bcf)
|
|
|
317
|
|
|
439
|
|
|
122
|
|
39
|
%
|
|
NGLs (MBbl)
|
|
|
7,102
|
|
|
15,550
|
|
|
8,448
|
|
119
|
%
|
|
Oil (MBbl)
|
|
|
1,311
|
|
|
2,078
|
|
|
767
|
|
58
|
%
|
|
Combined (Bcfe)
|
|
|
368
|
|
|
545
|
|
|
177
|
|
48
|
%
|
|
Daily combined production (MMcfe/d)
|
|
|
1,007
|
|
|
1,493
|
|
|
486
|
|
48
|
%
|
|
Average prices before effects of derivative settlements(2):
|
|
|
|
|
|
|
|
|
|
|
|
|
|
Natural gas (per Mcf)
|
|
$
|
4.10
|
|
$
|
2.37
|
|
$
|
(1.73)
|
|
(42)
|
%
|
|
NGLs (per Bbl)
|
|
$
|
46.23
|
|
$
|
17.01
|
|
$
|
(29.22)
|
|
(63)
|
%
|
|
Oil (per Bbl)
|
|
$
|
81.65
|
|
$
|
34.05
|
|
$
|
(47.60)
|
|
(58)
|
%
|
|
Combined (per Mcfe)
|
|
$
|
4.73
|
|
$
|
2.52
|
|
$
|
(2.21)
|
|
(47)
|
%
|
|
Average realized prices after effects of derivative settlements(2):
|
|
|
|
|
|
|
|
|
|
|
|
|
|
Natural gas (per Mcf)
|
|
$
|
4.52
|
|
$
|
4.15
|
|
$
|
(0.37)
|
|
(8)
|
%
|
|
NGLs (per Bbl)
|
|
$
|
46.23
|
|
$
|
20.57
|
|
$
|
(25.66)
|
|
(56)
|
%
|
|
Oil (per Bbl)
|
|
$
|
84.66
|
|
$
|
42.38
|
|
$
|
(42.28)
|
|
(50)
|
%
|
|
Combined (per Mcfe)
|
|
$
|
5.10
|
|
$
|
4.10
|
|
$
|
(1.00)
|
|
(20)
|
%
|
|
Average Costs (per Mcfe):
|
|
|
|
|
|
|
|
|
|
|
|
|
|
Lease operating
|
|
$
|
0.08
|
|
$
|
0.07
|
|
$
|
(0.01)
|
|
(13)
|
%
|
|
Gathering, compression, processing, and transportation
|
|
$
|
1.26
|
|
$
|
1.21
|
|
$
|
(0.05)
|
|
(4)
|
%
|
|
Production and ad valorem taxes
|
|
$
|
0.24
|
|
$
|
0.14
|
|
$
|
(0.10)
|
|
(42)
|
%
|
|
Marketing, net
|
|
$
|
0.14
|
|
$
|
0.23
|
|
$
|
0.09
|
|
64
|
%
|
|
Depletion, depreciation, amortization, and accretion
|
|
$
|
1.30
|
|
$
|
1.31
|
|
$
|
0.01
|
|
1
|
%
|
|
General and administrative (before equity-based compensation)
|
|
$
|
0.28
|
|
$
|
0.25
|
|
$
|
(0.03)
|
|
(11)
|
%
|
|
(2)
| |
Average sales prices shown in the table reflect both the before and after effects of our settled derivatives. Our calculation of such after effects includes gains on settlements for derivatives, which do not qualify for hedge accounting because we do not designate or document them as hedges for accounting purposes. Oil and NGLs production was converted at 6 Mcf per Bbl to calculate total Bcfe production and per Mcfe amounts. This ratio is an estimate of the equivalent energy content of the products and does not necessarily reflect their relative economic value. |
Discussion of Consolidated Exploration and Production Results for the Year Ended December 31, 2014 Compared to the Year Ended December 31, 2015
Natural gas, NGLs, and oil sales. Revenues from production of natural gas, NGLs, and oil decreased from $1.7 billion for the year ended December 31, 2014 to $1.4 billion for the year ended December 31, 2015, a decrease of $362 million, or 21%. Our production increased by 48% over that same period, from 368 Bcfe, or 1,007 MMcfe per day, for the year ended December 31, 2014 to 545 Bcfe, or 1,493 MMcfe per day, for the year ended December 31, 2015. Net equivalent prices before the effects of settled derivative gains decreased from $4.73 per Mcfe for the year ended December 31, 2014 to $2.52 per Mcfe for the year ended December 31, 2015, a decrease of 47%. Prices for natural gas, NGLs, and oil declined from 2014 levels. Net equivalent prices after the effects of gains on settled derivatives decreased from $5.10 per Mcfe for the year ended December 31, 2014 to $4.10 for the year ended December 31, 2015.
Increased production volumes accounted for an approximate $839 million increase in year-over-year product revenues (calculated as the change in year-to-year volumes times the prior year average price), and decreases in our equivalent prices accounted for an approximate $1.2 billion decrease in year-over-year product revenues (calculated as the change in year-to-year average price times current year production volumes). Production increases resulted from an increase in the number of producing wells as a result of our active drilling program. Based on our current drilling and completion plans for 2016 and the increasing size of our production base, we expect the rate of growth in our production to decline from the rates of growth realized in recent years.
Commodity derivative fair value gains. To achieve more predictable cash flows, and to reduce our exposure to price fluctuations, we enter into derivative contracts using fixed for variable swap contracts when management believes that favorable future sales prices for our natural gas, NGLs, and oil production can be secured. Because we do not designate these derivatives as accounting hedges, they do not receive accounting hedge treatment, and all mark-to-market gains or losses, as well as cash receipts or payments on settled derivative instruments, are recognized in our statements of operations. For the years ended December 31, 2014 and 2015, our hedges resulted in derivative fair value gains of $868 million and $2.4 billion, respectively. The derivative fair value gains included $136 million and $857 million of gains on settled derivatives for the years ended December 31, 2014 and 2015, respectively. Commodity derivative fair value gains or losses will vary based on future commodity prices and have no cash flow impact until the contracts are settled. Derivative asset or liability positions at the end of any accounting period may reverse to the extent natural gas, NGLs, and oil futures prices increase or decrease from their levels at the end of the accounting period, or as gains
or losses are realized through settlement. We expect continued volatility in commodity prices and the related fair value of our derivative instruments in the future.
Gathering, compression, and water handling and treatment revenues. Gathering, compression, and water handling and treatment revenues remained constant at $22 million for the years ended December 31, 2014 and 2015 (net of intercompany eliminations of $246 million and $365 million, respectively) primarily due to increased throughput from production, offset by decreased use of the fresh water distribution systems. These amounts represent the portion of such fees that are charged to outside working interest owners in Company-operated wells, as well as fees charged to other third parties for water provided by the Company or usage of Antero Midstream’s gathering pipelines.
Gain on sale of gathering system. In 2012, we closed the sale of a portion of our Marcellus Shale gathering system assets in West Virginia along with exclusive rights to gather our gas for a 20 year period within an area of dedication (“AOD”) to a joint venture owned by Crestwood Midstream Partners and Crestwood Holdings Partners LLC (together “Crestwood”). Under the terms of the contract, we could earn additional proceeds of $40 million if certain volume thresholds were met by December 31, 2014. As the volume thresholds were fully met during 2014, we recorded an additional $40 million gain on the sale of assets in 2014, which was paid by Crestwood in the first quarter of 2015.
Lease operating expenses. Lease operating expenses increased from $29 million (net of intercompany eliminations of $33 million) for the year ended December 31, 2014 to $36 million (net of intercompany eliminations of $49 million) for the year ended December 31, 2015, an increase of 23%. The increase is a result of an increase in the number of producing wells. On a per unit basis, lease operating expenses decreased from $0.08 per Mcfe for the year ended December 31, 2014 to $0.07 per Mcfe for the year ended December 31, 2015 as production from new wells caused overall production to increase at a faster rate than our lease operating costs. Lease operating expenses are expected to slowly increase on a per unit basis as properties mature and average production per well declines.
Gathering, compression, processing, and transportation expense. Gathering, compression, processing, and transportation expense increased from $461 million (net of intercompany eliminations of $89 million) for the year ended December 31, 2014 to $659 million (net of intercompany eliminations of $219 million) for the year ended December 31, 2015. The increase in these expenses is a result of the increase in production and the related firm transportation costs, and third-party gathering, compression and processing expenses. On a per-unit basis, total gathering, compression, processing, and transportation expenses decreased by 4%, from $1.26 per Mcfe for the year ended December 31, 2014 to $1.21 per Mcfe for the year ended December 31, 2015, primarily as a result of decreases in fuel costs as compared to the prior year due to lower natural gas prices.
We have entered into contracts for significant firm transportation volumes in advance of having sufficient production to fully utilize the capacity. Based on current projections for our 2016 annual production levels, we estimate that we could incur total annual net marketing costs of $95 million to $125 million for unutilized transportation capacity depending on the amount of unutilized capacity that can be marketed to third parties or utilized to transport third party gas. Additionally, in years subsequent to 2016, our commitments and obligations under firm transportation agreements continue to increase and our net marketing expense could continue to increase depending on utilization of our transportation capacity based on future production and how much, if any, future excess transportation can be marketed to third parties.
Production and ad valorem tax expense. Total production and ad valorem taxes decreased from $88 million for the year ended December 31, 2014 to $78 million for the year ended December 31, 2015, primarily as a result of a decrease in the estimate of ad valorem taxes payable by Antero Midstream, partially offset by increases in ad valorem taxes due to wells placed on-line during 2015. Production and ad valorem taxes as a percentage of natural gas, NGLs, and oil revenues before the effects of hedging increased from 5.1% for the year ended December 31, 2014 to 5.7% for the year ended December 31, 2015 as a result of certain volumetric production taxes in West Virginia that increased as a percentage of revenues as price declines were offset by a decrease in ad valorem taxes on midstream assets. Additionally, as production in Ohio increases at a higher rate than West Virginia, severance taxes as a percentage of revenue decrease due to lower severance tax rates in Ohio as compared to West Virginia. Legislative proposals in the State of Ohio to increase severance taxes on production from horizontally drilled wells could increase our future production tax rates in Ohio if such legislation is enacted.
Exploration expense. Exploration expense of $28 million for the year ended December 31, 2014 decreased to $4 million for the year ended December 31, 2015 primarily because of an overall decrease in lease acquisitions efforts, resulting in a decrease in unsuccessful lease acquisitions.
Impairment of unproved properties. Impairment of unproved properties increased from $15 million for the year ended
December 31, 2014 to $104 million for the year ended December 31, 2015, primarily due to the impairment of several groups of leases that we decided not to retain and develop. We charge impairment expense for expired or soon-to-be expired leases when we determine they are impaired based on factors such as remaining lease terms, reservoir performance, commodity price outlooks, or future plans to develop the acreage.
DD&A. DD&A increased from $478 million for the year ended December 31, 2014 to $710 million for the year ended December 31, 2015, primarily because of increased production. DD&A per Mcfe increased by 1%, from $1.30 per Mcfe during the year ended December 31, 2014 to $1.31 per Mcfe during the year ended December 31, 2015, primarily due to increased depreciation on midstream and water assets, partially offset by proved developed reserves increasing at a faster rate than the corresponding cost additions from wells completed during the year ended December 31, 2015.
We evaluate the carrying amount of our proved natural gas, NGLs, and oil properties for impairment on a field-by-field basis whenever events or changes in circumstances (such as the decline in commodity prices during 2015) indicate that a property’s carrying amount may not be recoverable. If the carrying amount exceeded the estimated undiscounted future cash flows (measured using future prices at the end of a quarter), we would further evaluate our proved properties and record an impairment charge if the carrying amount of our proved properties exceeded the estimated fair value of the properties. Due to the commodity price environment at December 31, 2015, we compared the carrying values of our proved properties to estimated future cash flows. As estimated future cash flows remained higher than the carrying value of our properties at December 31, 2015, we did not further evaluate our proved properties for impairment.
General and administrative and equity-based compensation expense. General and administrative expense (before equity-based compensation expense) increased from $104 million for the year ended December 31, 2014 to $136 million for the year ended December 31, 2015, primarily as a result of increased staffing levels and related salary and benefits expenses, as well as increases in legal and other general corporate expenses, all of which are due to our increase in development activities and production levels. On a per unit basis, general and administrative expense before equity-based compensation decreased by 11%, from $0.28 per Mcfe during the year ended December 31, 2014 to $0.25 per Mcfe during the year ended December 31, 2015, primarily due to a 48% increase in production. We had 444 employees as of December 31, 2014 and 480 employees as of December 31, 2015.
Noncash equity-based compensation expense decreased from $112 million for the year ended December 31, 2014 to $98 million for the year ended December 31, 2015 as a result of a $46 million decrease in amortization of expense related to the vesting of profits interests, partially offset by a $32 million increase in equity-based compensation related to restricted stock unit, stock option, and Antero Midstream phantom unit awards. See note 8 to the consolidated financial statements included elsewhere in this report for more information on equity-based compensation awards.
Contract termination and rig stacking. We incurred contract termination and rig stacking costs of $39 million during the year ended December 31, 2015. Of this total, $28 million is related to the buy-back and termination of a firm sales contract which was priced at an unfavorable Dominion South index. The remaining $11 million represents fees incurred upon the delay or cancellation of drilling contracts with third-party contractors in the first quarter of 2015 in order to align our drilling and completion activity level with our 2015 capital budget.
Interest expense. Interest expense increased from $160 million for the year ended December 31, 2014 to $234 million for the year ended December 31, 2015, primarily due to increased indebtedness. Interest expense includes approximately $8 million and $10 million of non-cash amortization of deferred financing costs for the years ended December 31, 2014 and 2015, respectively.
Loss on early extinguishment of debt. On May 23, 2014, we redeemed our outstanding 7.25% senior notes due 2019, resulting in a loss on early redemption of $20 million for the year ended December 31, 2014.
Income tax expense. Income tax expense increased from $446 million for the year ended December 31, 2014 to $576 million for the year ended December 31, 2015 because of the increase in pre-tax income compared to the prior year. Equity-based compensation expense of $84 million in 2014 and $38 million in 2015 related to the vested profits interests charge is not deductible for federal or state income taxes and, along with the effect of state taxes, largely accounts for the difference between the federal tax rate of 35% and the rates at which income tax expense was provided for the years ended December 31, 2014 and 2015.
At December 31, 2015, we had approximately $1.4 billion of U.S. federal net operating loss carryforwards (NOLs) and approximately $1.2 billion of state NOLs, which expire from 2024 through 2035. From time to time there has been proposed legislation in the U.S. Congress to eliminate or limit future deductions for intangible drilling costs. Such legislation could significantly affect our future taxable position, if passed. The impact of any change will be recorded in the period that any such
legislation might be enacted.
The calculation of our tax liabilities involves uncertainties in the application of complex tax laws and regulations. We give financial statement recognition to those tax positions that we believe are more-likely-than-not to be sustained upon examination by the Internal Revenue Service or state revenue authorities. The financial statements include unrecognized benefits at December 31, 2015 of $11 million that, if recognized, would result in a reduction of current income taxes payable and an increase in noncurrent deferred tax liabilities. As of December 31, 2015, we have accrued approximately $1.6 million of interest on unrecognized tax benefits.
During 2015, the State of West Virginia completed its examination of the tax returns of Antero Resources Corporation for its tax years 2011 through 2013. There were no material adjustments to our provision for income taxes as a result of the examination.
Income from discontinued operations. In 2012, the Company sold its Piceance Basin assets in Colorado and its Arkoma Basin assets in Oklahoma. Total proceeds from the sales, including liquidation of related hedge positions, were approximately $843 million and pre-tax losses on the asset sales of approximately $796 million were recorded in 2012. Pre-tax losses were adjusted downward in 2014 by $3.6 million for the resolution of certain liabilities recorded at the time of the sales and settlement of final contractual purchase price adjustments.
Adjusted EBITDAX. Adjusted EBITDAX increased from $1.16 billion for the year ended December 31, 2014 to $1.22 billion for the year ended December 31, 2015, an increase of 5%. The increase in Adjusted EBITDAX was primarily due to a 48% increase in production, which was partially offset by a 20% decrease in the average per Mcfe price received after the impact of cash settled derivatives, net of the related increases in cash operating and general and administrative expenses. See “Item 6. Selected Financial Data” included elsewhere in this report for a definition of Adjusted EBITDAX (a non‑GAAP measure) and a reconciliation of Adjusted EBITDAX to net income from continuing operations including noncontrolling interest and net cash provided by operating activities.
Discussion of Segment Results for the Year Ended December 31, 2014 Compared to the Year Ended December 31, 2015
Gathering and Compression. Revenue for the gathering and compression segment increased from $96 million for the year ended December 31, 2014 to $231 million for the year ended December 31, 2015, an increase of $135 million, or 141%. Gathering revenues increased by $112 million from the prior year and compression revenues increased by $23 million as additional wells on production increased throughput volumes. Total operating expenses related to gathering and compression increased from $74 million for the year ended December 31, 2014 to $131 million for the year ended December 31, 2015 as a result of the increased throughput volumes, as well as increases in depreciation expense due to a larger base of gathering and compression assets.
Water Handling and Treatment. Revenue for the water handling and treatment segment decreased from $172 million for the year ended December 31, 2014 to $157 million for the year ended December 31, 2015, a decrease of $15 million or 9%. The decrease was due to decreased use of the water systems in our hydraulic fracturing activities as a result of the deferral of some well completions, partially offset by revenues generated from the commencement of wastewater treatment services. The volume of water delivered through the fresh water distribution systems decreased from 48.3 MMBbls for the year ended December 31, 2014 to 35.0 MMBbls for the year ended December 31, 2015. Operating expenses for the water handling and treatment segment increased from $61 million for the year ended December 31, 2014 to $90 million for the year ended December 31, 2015 as a result of expenses incurred by the commencement of wastewater treatment services and an increase in depreciation expense due to a larger base of fresh water distribution assets, partially offset by a decrease in expenses related to water distribution as a result of the decreased use of the water systems.
Marketing. Where permitted, we purchase and sell third-party natural gas and NGLs and market our excess firm transportation capacity, or engage third parties to conduct these activities on our behalf, in order to optimize the revenues from these transportation agreements. We enter into long-term firm transportation agreements for a significant part of our current and expected future production in order to secure guaranteed capacity to favorable markets. Marketing revenues of $54 million and $176 million and expenses of $103 million and $299 million for the years ended December 31, 2014 and 2015, respectively, relate to these activities. Net losses on our marketing activities were $49 million and $123 million for the years ended December 31, 2014 and 2015, respectively. Marketing costs include firm transportation costs related to current excess capacity as well as the cost of third-party purchased gas and NGLs. This includes firm transportation costs of $59 million and $132 million for the years ended December 31, 2014 and 2015, respectively, related to unutilized excess capacity which increased due to new firm transportation agreements. Based on current projected 2016 annual production levels, we estimate that we could incur total annual net marketing costs of $95 million to $125 million in 2016 for unutilized transportation capacity depending on the amount of unutilized capacity that can be marketed to
third parties or utilized to transport third party gas and capture positive basis differentials. Additionally, in years subsequent to 2016, our commitments and obligations under firm transportation agreements continue to increase and our net marketing expense could continue to increase depending on utilization of our transportation capacity based on future production and how much, if any, future excess transportation can be marketed to third parties.
Year Ended December 31, 2013 Compared to Year Ended December 31, 2014
Marketing activities began in the second quarter of 2014 and were subsequently determined to be a new reportable segment. The operating results and assets of the Company’s reportable segments were as follows for the years ended December 31, 2013 and 2014 (in thousands):
|
|
|
|
|
|
|
|
|
|
|
|
|
|
|
|
|
|
|
|
|
|
|
|
|
|
|
|
|
|
|
Exploration
and
|
|
Gathering and
|
|
Water
|
|
Elimination of
intersegment
|
|
Consolidated
|
|
|
|
|
production
|
|
compression
|
|
handling
|
|
transactions
|
|
total
|
|
|
Year ended December 31, 2013:
|
|
|
|
|
|
|
|
|
|
|
|
|
|
Sales and revenues:
|
|
|
|
|
|
|
|
|
|
|
|
|
|
Third-party
|
|
$
|
1,313,134
|
|
—
|
|
—
|
|
—
|
|
1,313,134
|
|
|
Intersegment
|
|
|
—
|
|
22,363
|
|
35,871
|
|
(58,234)
|
|
—
|
|
|
|
|
$
|
1,313,134
|
|
22,363
|
|
35,871
|
|
(58,234)
|
|
1,313,134
|
|
|
|
|
|
|
|
|
|
|
|
|
|
|
|
|
Operating expenses:
|
|
|
|
|
|
|
|
|
|
|
|
|
|
Lease operating
|
|
$
|
9,439
|
|
—
|
|
3,843
|
|
(3,843)
|
|
9,439
|
|
|
Gathering, compression, processing, and transportation
|
|
|
238,712
|
|
2,079
|
|
—
|
|
(22,363)
|
|
218,428
|
|
|
Depletion, depreciation, and amortization
|
|
|
219,757
|
|
11,346
|
|
2,773
|
|
—
|
|
233,876
|
|
|
General and administrative expense (before equity-based compensation)
|
|
|
50,442
|
|
7,193
|
|
2,523
|
|
—
|
|
60,158
|
|
|
Equity-based compensation expense
|
|
|
340,931
|
|
15,931
|
|
8,418
|
|
—
|
|
365,280
|
|
|
Other operating expenses
|
|
|
82,787
|
|
—
|
|
1,959
|
|
—
|
|
84,746
|
|
|
Total
|
|
|
942,068
|
|
36,549
|
|
19,516
|
|
(26,206)
|
|
971,927
|
|
|
Operating income (loss)
|
|
$
|
371,066
|
|
(14,186)
|
|
16,355
|
|
(32,028)
|
|
341,207
|
|
|
|
|
|
|
|
|
|
|
|
|
|
|
|
|
|
|
|
|
|
|
|
|
|
|
|
|
|
|
|
|
|
|
|
|
Exploration
and
|
|
Gathering and
|
|
Water
|
|
|
|
Elimination of
intersegment
|
|
Consolidated
|
|
|
|
|
production
|
|
compression
|
|
handling
|
|
Marketing
|
|
transactions
|
|
total
|
|
|
Year ended December 31, 2014:
|
|
|
|
|
|
|
|
|
|
|
|
|
|
|
|
Sales and revenues:
|
|
|
|
|
|
|
|
|
|
|
|
|
|
|
|
Third-party
|
|
$
|
2,644,953
|
|
6,810
|
|
15,265
|
|
53,604
|
|
—
|
|
2,720,632
|
|
|
Intersegment
|
|
|
195
|
|
88,936
|
|
156,660
|
|
—
|
|
(245,791)
|
|
—
|
|
|
|
|
$
|
2,645,148
|
|
95,746
|
|
171,925
|
|
53,604
|
|
(245,791)
|
|
2,720,632
|
|
|
|
|
|
|
|
|
|
|
|
|
|
|
|
|
|
|
Operating expenses:
|
|
|
|
|
|
|
|
|
|
|
|
|
|
|
|
Lease operating
|
|
$
|
28,041
|
|
—
|
|
34,737
|
|
—
|
|
(33,437)
|
|
29,341
|
|
|
Gathering, compression, processing, and transportation
|
|
|
536,879
|
|
13,497
|
|
—
|
|
—
|
|
(88,963)
|
|
461,413
|
|
|
Depletion, depreciation, and amortization
|
|
|
424,684
|
|
36,972
|
|
16,240
|
|
—
|
|
—
|
|
477,896
|
|
|
General and administrative expense (before equity-based compensation)
|
|
|
85,701
|
|
13,416
|
|
5,332
|
|
—
|
|
(168)
|
|
104,281
|
|
|
Equity-based compensation expense
|
|
|
100,634
|
|
8,619
|
|
2,999
|
|
—
|
|
—
|
|
112,252
|
|
|
Other operating expenses
|
|
|
128,419
|
|
1,973
|
|
1,888
|
|
103,435
|
|
—
|
|
235,715
|
|
|
Total
|
|
|
1,304,358
|
|
74,477
|
|
61,196
|
|
103,435
|
|
(122,568)
|
|
1,420,898
|
|
|
Operating income (loss)
|
|
$
|
1,340,790
|
|
21,269
|
|
110,729
|
|
(49,831)
|
|
(123,223)
|
|
1,299,734
|
|
The following tables set forth selected operating data for the year ended December 31, 2013 compared to the year ended December 31, 2014:
|
|
|
|
|
|
|
|
|
|
|
|
|
|
|
|
|
|
|
|
|
|
|
|
|
|
|
|
|
|
|
Year ended December 31,
|
|
Amount of
Increase
|
|
Percent
|
|
|
(in thousands)
|
|
2013
|
|
2014
|
|
(Decrease)
|
|
Change
|
|
|
Operating revenues:
|
|
|
|
|
|
|
|
|
|
|
|
|
|
Natural gas sales
|
|
$
|
689,198
|
|
$
|
1,301,349
|
|
$
|
612,151
|
|
89
|
%
|
|
NGLs sales
|
|
|
111,663
|
|
|
328,323
|
|
|
216,660
|
|
194
|
%
|
|
Oil sales
|
|
|
20,584
|
|
|
107,080
|
|
|
86,496
|
|
420
|
%
|
|
Gathering, compression, and water handling and treatment
|
|
|
—
|
|
|
22,075
|
|
|
22,075
|
|
*
|
|
|
Marketing
|
|
|
—
|
|
|
53,604
|
|
|
53,604
|
|
*
|
|
|
Commodity derivative fair value gains
|
|
|
491,689
|
|
|
868,201
|
|
|
376,512
|
|
77
|
%
|
|
Gain on sale of gathering system
|
|
|
—
|
|
|
40,000
|
|
|
40,000
|
|
*
|
|
|
Total operating revenues
|
|
|
1,313,134
|
|
|
2,720,632
|
|
|
1,407,498
|
|
107
|
%
|
|
Operating expenses:
|
|
|
|
|
|
|
|
|
|
|
|
|
|
Lease operating
|
|
|
9,439
|
|
|
29,341
|
|
|
19,902
|
|
211
|
%
|
|
Gathering, compression, processing, and transportation
|
|
|
218,428
|
|
|
461,413
|
|
|
242,985
|
|
111
|
%
|
|
Production and ad valorem taxes
|
|
|
50,481
|
|
|
87,918
|
|
|
37,437
|
|
74
|
%
|
|
Marketing
|
|
|
—
|
|
|
103,435
|
|
|
103,435
|
|
*
|
|
|
Exploration
|
|
|
22,272
|
|
|
27,893
|
|
|
5,621
|
|
25
|
%
|
|
Impairment of unproved properties
|
|
|
10,928
|
|
|
15,198
|
|
|
4,270
|
|
39
|
%
|
|
Depletion, depreciation, and amortization
|
|
|
233,876
|
|
|
477,896
|
|
|
244,020
|
|
104
|
%
|
|
Accretion of asset retirement obligations
|
|
|
1,065
|
|
|
1,271
|
|
|
206
|
|
19
|
%
|
|
General and administrative (before equity-based compensation)
|
|
|
60,158
|
|
|
104,281
|
|
|
44,123
|
|
73
|
%
|
|
Equity-based compensation
|
|
|
365,280
|
|
|
112,252
|
|
|
(253,028)
|
|
(69)
|
%
|
|
Total operating expenses
|
|
|
971,927
|
|
|
1,420,898
|
|
|
448,971
|
|
46
|
%
|
|
Operating income
|
|
|
341,207
|
|
|
1,299,734
|
|
|
958,527
|
|
281
|
%
|
|
|
|
|
|
|
|
|
|
|
|
|
|
|
|
Other Expenses:
|
|
|
|
|
|
|
|
|
|
|
|
|
|
Interest expense
|
|
|
(136,617)
|
|
|
(160,051)
|
|
|
(23,434)
|
|
17
|
%
|
|
Loss on early extinguishment of debt
|
|
|
(42,567)
|
|
|
(20,386)
|
|
|
22,181
|
|
(52)
|
%
|
|
Total other expenses
|
|
|
(179,184)
|
|
|
(180,437)
|
|
|
(1,253)
|
|
1
|
%
|
|
Income from continuing operations before income taxes and discontinued operations
|
|
|
162,023
|
|
|
1,119,297
|
|
|
957,274
|
|
591
|
%
|
|
Income tax expense
|
|
|
(186,210)
|
|
|
(445,672)
|
|
|
(259,462)
|
|
139
|
%
|
|
Income (loss) from continuing operations
|
|
|
(24,187)
|
|
|
673,625
|
|
|
697,812
|
|
*
|
|
|
Income from discontinued operations
|
|
|
5,257
|
|
|
2,210
|
|
|
(3,047)
|
|
(58)
|
%
|
|
Net income (loss) and comprehensive income (loss) including noncontrolling interest
|
|
|
(18,930)
|
|
|
675,835
|
|
|
694,765
|
|
*
|
|
|
Net income and comprehensive income attributable to noncontrolling interest
|
|
|
—
|
|
|
2,248
|
|
|
2,248
|
|
*
|
|
|
Net income (loss) and comprehensive income (loss) attributable to Antero Resources Corporation
|
|
$
|
(18,930)
|
|
$
|
673,587
|
|
$
|
692,517
|
|
*
|
|
|
|
|
|
|
|
|
|
|
|
|
|
|
|
|
Adjusted EBITDAX (1)
|
|
$
|
649,358
|
|
$
|
1,164,015
|
|
$
|
514,657
|
|
79
|
%
|
|
(1)
| |
See “Item 6. Selected Financial Data” included elsewhere in this report for a definition of Adjusted EBITDAX (a non‑GAAP measure) and a reconciliation of Adjusted EBITDAX to net income (loss) from continuing operations including noncontrolling interest and net cash provided by operating activities. |
*Not meaningful or applicable.
|
|
|
|
|
|
|
|
|
|
|
|
|
|
|
|
|
|
|
|
|
|
|
|
|
|
|
|
|
|
|
Year ended December 31,
|
|
Amount of
Increase
|
|
Percent
|
|
|
|
|
2013
|
|
2014
|
|
(Decrease)
|
|
Change
|
|
|
Production data:
|
|
|
|
|
|
|
|
|
|
|
|
|
|
Natural gas (Bcf)
|
|
|
177
|
|
|
317
|
|
|
140
|
|
80
|
%
|
|
NGLs (MBbl)
|
|
|
2,123
|
|
|
7,102
|
|
|
4,979
|
|
235
|
%
|
|
Oil (MBbl)
|
|
|
226
|
|
|
1,311
|
|
|
1,085
|
|
482
|
%
|
|
Combined (Bcfe)
|
|
|
191
|
|
|
368
|
|
|
177
|
|
93
|
%
|
|
Daily combined production (MMcfe/d)
|
|
|
522
|
|
|
1,007
|
|
|
485
|
|
93
|
%
|
|
Average prices before effects of derivative settlements(2):
|
|
|
|
|
|
|
|
|
|
|
|
|
|
Natural gas (per Mcf)
|
|
$
|
3.90
|
|
$
|
4.10
|
|
$
|
0.20
|
|
5
|
%
|
|
NGLs (per Bbl)
|
|
$
|
52.61
|
|
$
|
46.23
|
|
$
|
(6.38)
|
|
(12)
|
%
|
|
Oil (per Bbl)
|
|
$
|
91.27
|
|
$
|
81.65
|
|
$
|
(9.62)
|
|
(11)
|
%
|
|
Combined (per Mcfe)
|
|
$
|
4.31
|
|
$
|
4.73
|
|
$
|
0.42
|
|
10
|
%
|
|
Average realized prices after effects of derivative settlements(2):
|
|
|
|
|
|
|
|
|
|
|
|
|
|
Natural gas (per Mcf)
|
|
$
|
4.82
|
|
$
|
4.52
|
|
$
|
(0.30)
|
|
(6)
|
%
|
|
NGLs (per Bbl)
|
|
$
|
52.61
|
|
$
|
46.23
|
|
$
|
(6.38)
|
|
(12)
|
%
|
|
Oil (per Bbl)
|
|
$
|
99.06
|
|
$
|
84.66
|
|
$
|
(14.40)
|
|
(15)
|
%
|
|
Combined (per Mcfe)
|
|
$
|
5.17
|
|
$
|
5.10
|
|
$
|
(0.07)
|
|
(1)
|
%
|
|
Average Costs (per Mcfe):
|
|
|
|
|
|
|
|
|
|
|
|
|
|
Lease operating
|
|
$
|
0.05
|
|
$
|
0.08
|
|
$
|
0.03
|
|
60
|
%
|
|
Gathering, compression, processing, and transportation
|
|
$
|
1.15
|
|
$
|
1.26
|
|
$
|
0.11
|
|
10
|
%
|
|
Production and ad valorem taxes
|
|
$
|
0.26
|
|
$
|
0.24
|
|
$
|
(0.02)
|
|
(8)
|
%
|
|
Marketing, net
|
|
$
|
—
|
|
$
|
0.13
|
|
$
|
0.13
|
|
*
|
|
|
Depletion, depreciation, amortization, and accretion
|
|
$
|
1.23
|
|
$
|
1.30
|
|
$
|
0.07
|
|
6
|
%
|
|
General and administrative (before equity-based compensation)
|
|
$
|
0.32
|
|
$
|
0.28
|
|
$
|
(0.04)
|
|
(13)
|
%
|
|
(2)
| |
Average sales prices shown in the table reflect both the before and after effects of our settled derivatives. Our calculation of such after effects includes gains on settlements for derivatives, which do not qualify for hedge accounting because we do not designate or document them as hedges for accounting purposes. Oil and NGLs production was converted at 6 Mcf per Bbl to calculate total Bcfe production and per Mcfe amounts. This ratio is an estimate of the equivalent energy content of the products and does not necessarily reflect their relative economic value. |
Discussion of Consolidated Exploration and Production Results for the Year Ended December 31, 2013 Compared to the Year Ended December 31, 2014
Natural gas, NGLs, and oil sales. Revenues from production of natural gas, NGLs, and oil increased from $821 million for the year ended December 31, 2013 to $1.7 billion for the year ended December 31, 2014, an increase of $915 million, or 111%. Our production increased by 93% over that same period, from 191 Bcfe, or 522 MMcfe per day, for the year ended December 31, 2013 to 368 Bcfe, or 1,007 MMcfe per day, for the year ended December 31, 2014. Net equivalent prices before the effects of settled derivative gains increased from $4.31 per Mcfe for the year ended December 31, 2013 to $4.73 for the year ended December 31, 2014, an increase of 10%. The 10% increase in net equivalent prices for the year ended December 31, 2014 compared to the prior year resulted from an increase in the mix of production of NGLs and oil compared to the prior year as well as increases in the prices of natural gas, which were partially offset by decreases in the prices of NGLs and oil. Net equivalent prices after the effects of gains on settled commodity hedges were $5.17 per Mcfe for the year ended December 31, 2013 compared to $5.10 per Mcfe for the year ended December 31, 2014.
Increased production volumes accounted for an approximate $762 million increase in year-over-year product revenues (calculated as the change in year-to-year volumes times the prior year average price), and increases in our equivalent prices accounted for an approximate $153 million increase in year-over-year product revenues (calculated as the change in year-to-year average price times current year production volumes). Production increases resulted from an increase in the number of producing wells as a result of our ongoing drilling program.
Commodity derivative fair value gains. To achieve more predictable cash flows, and to reduce our exposure to price fluctuations, we enter into derivative contracts using fixed for variable swap contracts when management believes that favorable future sales prices for our natural gas, NGLs, and oil production can be secured. Because we do not designate these derivatives as accounting hedges, they do not receive accounting hedge treatment, and all mark-to-market gains or losses, as well as cash receipts or payments on settled derivative instruments, are recognized in our statements of operations. For the years ended December 31, 2013 and 2014, our hedges resulted in derivative fair value gains of $492 million and $868 million, respectively. The derivative fair value gains included $164 million and $136 million of gains on settled derivatives for the years ended December 31, 2013 and 2014, respectively. Commodity derivative fair value gains or losses will vary based on future commodity prices and have no cash flow
impact until the contracts are settled. Derivative asset or liability positions at the end of any accounting period may reverse to the extent natural gas, NGLs, and oil futures prices increase or decrease from their levels at the end of the accounting period, or as gains or losses are realized through settlement. We expect continued volatility in commodity prices and the related fair value of our derivative instruments in the future.
Gathering, compression, and water handling and treatment. Beginning in the fourth quarter of 2013, we began to recognize our midstream gathering, compression, and water handling and treatment operations as reportable segments. Gathering, compression, and water handling and treatment fees of $22 million (net of intercompany eliminations of $246 million) during the year ended December 31, 2014 represent the portion of such fees that are charged to outside working interest owners in Company-operated wells, as well as fees charged to other third parties for water provided by the Company or usage of Antero Midstream’s gathering pipelines.
Gain on sale of gathering system. As discussed above, in 2012, we closed the sale of a portion of our Marcellus Shale gathering system assets in West Virginia along with exclusive rights to gather our gas for a 20 year period within an AOD to a joint venture owned by Crestwood. Under the terms of the contract, we could earn additional proceeds of $40 million if certain volume thresholds were met by December 31, 2014. As the volume thresholds were fully met during 2014, we recorded an additional $40 million of gain on the sale of assets in 2014, which was paid by Crestwood in the first quarter of 2015.
Lease operating expenses. Lease operating expenses increased from $9.4 million (net of intercompany eliminations of $4 million) for the year ended December 31, 2013 to $29.3 million (net of intercompany eliminations of $33 million) for the year ended December 31, 2014, an increase of 211%. The increase is a result of an increase in the number of producing wells. On a per unit basis, lease operating expenses increased from $0.05 per Mcfe for the year ended December 31, 2013 to $0.08 for the year ended December 31, 2014. Lease operating expenses per unit increased as a larger proportion of wells have been on production for longer periods of time compared to the prior year. Further, per unit costs also increased as a larger proportion of our wells produced condensate at the wellhead. Lease operating expenses are expected to slowly increase on a per unit basis as properties mature and average production per well declines.
Gathering, compression, processing, and transportation expense. Gathering, compression, processing, and transportation expense increased from $218 million (net of intercompany eliminations of $22 million) for the year ended December 31, 2013 to $461 million (net of intercompany eliminations of $89 million) for the year ended December 31, 2014. The increase in these expenses was a result of the increase in production and related firm transportation costs, and third-party gathering, compression and processing expenses. On a per-unit basis, total gathering, compression, processing and transportation expenses increased from $1.15 per Mcfe for the year ended December 31, 2013 to $1.26 for the year ended December 31, 2014 as a larger proportion of our gas was processed in 2014 as compared to 2013.
Production and ad valorem tax expense. Total production and ad valorem taxes increased from $50 million for the year ended December 31, 2013 to $88 million for the year ended December 31, 2014, primarily as a result of increased production and a larger midstream asset base subject to ad valorem taxes. Production taxes as a percentage of natural gas, NGLs, and oil revenues before the effects of hedging were 5.1% for the year ended December 31, 2014 compared to 6.1% 2013. Production taxes decreased as a percentage of revenues as production from Ohio increased. Ohio has lower severance tax rates than West Virginia.
Exploration expense. Exploration expense of $22 million for the year ended December 31, 2013 increased to expense of $28 million for the year ended December 31, 2014 primarily because of an overall increase in lease acquisition efforts, resulting in an increase in unsuccessful lease acquisitions.
Impairment of unproved properties. Impairment of unproved properties increased from $11 million for the year ended December 31, 2013 to $15 million for the year ended December 31, 2014. We charge impairment expense for expired or soon-to-be expired leases when we determine they are impaired based on factors such as remaining lease terms, reservoir performance, commodity price outlooks or future plans to develop the acreage.
DD&A. DD&A increased from $234 million for the year ended December 31, 2013 to $478 million for the year ended December 31, 2014, primarily because of increased production. DD&A per Mcfe increased by 6%, from $1.23 per Mcfe during the year ended December 31, 2013 to $1.30 per Mcfe during the year ended December 31, 2014, primarily due to increased depreciation related to midstream assets and facilities.
As discussed above, we evaluate the carrying amount of our proved natural gas, NGLs, and oil properties for impairment on a field-by-field basis whenever events or changes in circumstances (such as the decline in commodity prices during 2015) indicate that a property’s carrying amount may not be recoverable. No impairment expenses were recorded for the years ended December 31, 2013
and 2014 for proved properties.
General and administrative and equity-based compensation expense. General and administrative expense (before equity-based compensation expense) increased from $60 million for the year ended December 31, 2013 to $104 million for the year ended December 31, 2014, primarily as a result of increased staffing levels and related salary and benefits expenses, as well as increases in legal and other general corporate expenses, all of which are due to our increase in development activities and production levels. On a per unit basis, general and administrative expense before equity-based compensation decreased by 13%, from $0.32 per Mcfe during the year ended December 31, 2013 to $0.28 per Mcfe during the year ended December 31, 2014 primarily due to a 93% increase in production. We had 233 employees as of December 31, 2013 and 444 employees as of December 31, 2014.
Noncash equity-based compensation expense decreased from $365 million for the year ended December 31, 2013 to $112 million for the year ended December 31, 2014 as a result of a $281 million decrease in amortization expense related to the vesting of profits interest, partially offset by a $28 million increase in equity-based compensation primarily related to restricted stock unit, stock option, and Antero Midstream phantom unit awards. See note 8 to the consolidated financial statements included elsewhere in this report for more information on equity-based compensation awards.
Interest expense. Interest expense increased from $137 million for the year ended December 31, 2013 to $160 million for the year ended December 31, 2014, primarily due to increased indebtedness. Interest expense includes approximately $6 million and $8 million of non-cash amortization of deferred financing costs for the years ended December 31, 2013 and 2014, respectively.
Income tax expense. Income tax expense increased from $186 million for the year ended December 31, 2013 to $446 million for the year ended December 31, 2014 because of the increase in pre-tax income year-over-year. Equity-based compensation expense of $365 million in 2013 and $84 million in 2014 related to the vested profits interests charge is not deductible for federal or state income taxes and, along with the effect of state taxes, largely accounted for the difference between the federal tax rate of 35% and the rates at which income tax expense was provided for the years ended December 31, 2013 and 2014.
During 2014, the Internal Revenue Service completed its examination of the tax returns of Antero Resources Finance Corporation (which was merged with Antero Resources Corporation in December 2013) for its tax years 2011 and 2012. There were no adjustments to our provision for income taxes as a result of the examination.
Income from discontinued operations. In 2012, the Company sold its Piceance Basin assets in Colorado and its Arkoma Basin assets in Oklahoma. Total proceeds from the sales, including liquidation of related hedge positions, were approximately $843 million and pre-tax losses on the asset sales of approximately $796 million were recorded in 2012. Pre-tax losses were adjusted downward in 2013 and 2014 by $8.5 million and $3.6 million for the resolution of certain liabilities recorded at the time of the sales and settlement of final contractual purchase price adjustments.
Adjusted EBITDAX. Adjusted EBITDAX increased from $649 million for the year ended December 31, 2013 to $1.16 billion for the year ended December 31, 2014, an increase of 79%. The increase in Adjusted EBITDAX was primarily due to a 93% increase in production, which was partially offset by a 1% decrease in the average per Mcfe price received after the impact of cash settled derivatives, net of the related increases in cash operating and general and administrative expenses. See “Item 6. Selected Financial Data” included elsewhere in this report for a definition of Adjusted EBITDAX (a non‑GAAP measure) and a reconciliation of Adjusted EBITDAX to net income (loss) from continuing operations including noncontrolling interest and net cash provided by operating activities.
Discussion of Segment Results for the Year Ended December 31, 2013 Compared to the Year Ended December 31, 2014
Gathering and Compression. Revenue for the gathering and compression segment increased from $22 million for the year ended December 31, 2013 to $96 million for the year ended December 31, 2014, an increase of $73 million, or 327%. Gathering revenues increased by $68 million from the prior year and compression revenues increased by $5 million as additional wells on production increased throughput volumes. Total operating expenses related to gathering and compression increased from $36 million in 2013 to $74 million in 2014 as a result of the increased throughput volumes.
Water Handling and Treatment. Revenue for the water handling and treatment segment increased from $36 million for the year ended December 31, 2013 to $172 million for the year ended December 31, 2014, an increase of $136 million. The increase was due driven by the build out of the water systems and resulting increased use of the water systems in our hydraulic fracturing activities as well as the addition of a third-party customer. The volume of water delivered through the system increased from 10.5 MMBbls for the year ended December 31, 2013 to 48.3 MMBbls for the year ended December 31, 2014. Operating expenses for the water handling and treatment segment increased from $20 million for the year ended December 31, 2013 to $61 million for the year ended December 31, 2014 as a result of the increased use of the systems.
Marketing. Marketing revenues were $54 million and expenses were $103 million for the year ended December 31, 2014. Net losses on our marketing activities were $49 million for the year ended December 31, 2014. Marketing costs include firm transportation costs related to current excess capacity as well as the cost of third-party purchased gas and NGLs. This included firm transportation costs of $59 million for the year ended December 31, 2014 related to unutilized excess capacity. We enter into long-term firm transportation agreements for a significant part of our current and expected future production in order to secure guaranteed capacity to favorable markets.
Capital Resources and Liquidity
Historically, our primary sources of liquidity have been through issuances of debt and equity securities, borrowings under our revolving credit facility, asset sales, and net cash provided by operating activities. During 2015, we raised capital from the issuance of $750 million of 5.625% senior notes due 2023, from an offering of our common stock which resulted in net proceeds of approximately $538 million, and from a private placement of approximately $241 million of common units representing limited partner interests in our subsidiary, Antero Midstream. The proceeds from the private placement of Antero Midstream common units were transferred to Antero in connection with the dropdown of the water handling and treatment assets to Antero Midstream, and were used to repay amounts outstanding under Antero’s revolving credit facility. Historically, our primary use of cash has been for the exploration, development, and acquisition of natural gas, NGLs, and oil properties, as well as for development of gathering, compression, and water handling and treatment infrastructure. Additionally, in August 2015, we commenced development on an advanced wastewater treatment complex in West Virginia, which was contributed to Antero Midstream in connection with the contribution of our water handling and treatment assets. As we pursue reserve and production growth, we continually monitor what capital resources, including equity and debt financings, are available to meet our future financial obligations, planned capital expenditure activities, and liquidity requirements. Our future success in growing proved reserves and production will be highly dependent on the capital resources available to us.
As of December 31, 2015, we had 3,719 potential horizontal well locations, which will take many years to develop. More specifically, our proved undeveloped reserves will require an estimated $5.1 billion of development capital over the next five years in order to fully develop the properties associated with our proved reserves. A significant portion of this capital requirement will be funded out of operating cash flows. However, we may be required to generate or raise significant capital to develop our proved undeveloped reserves. Our capital budget may be adjusted as business conditions warrant, and delays in the development of reserves could cause us to have to reclassify our proved undeveloped reserves as unproved resources. If natural gas, NGLs, and oil prices decline to levels below our acceptable levels, or costs increase to levels above our acceptable levels, we could choose to defer a significant portion of our budgeted capital expenditures until later periods to achieve the desired balance between sources and uses of liquidity, and to prioritize capital projects that we believe have the highest expected returns and potential to generate near-term cash flow.
Antero’s revolving credit facility has a borrowing base of $4.5 billion and current lender commitments of $4.0 billion. The borrowing base is redetermined every six months based on reserves, gas, NGLs, and oil commodity prices, and the value of our hedge portfolio. The next redetermination of the borrowing base is scheduled to occur in April 2016. For a discussion of the risks of a decrease in the borrowing base under our revolving credit facility, see “Item 1A. Risk Factors—The borrowing base under our revolving credit facility may be reduced in light of recent commodity price declines, which could hinder or prevent us from meeting our future capital needs.” Our commodity hedge position provides us with additional liquidity as it provides us with the relative certainty of receiving a significant portion of our future expected revenues from operations despite potential declines in the price of natural gas, NGLs, or oil. Our ability to make significant additional acquisitions for cash would require us to obtain additional equity or debt financing, which we may not be able to obtain on terms acceptable to us, or at all. Our revolving credit facility is funded by a syndicate of 29 banks. We believe that the participants in the syndicate have the capability to fund up to their current commitment. If one or more banks should not be able to do so, we may not have the full availability of our revolving credit facility. In addition to Antero’s credit facility, Antero Midstream has a revolving credit facility that provides for lender commitments of $1.5 billion.
For the year ended December 31, 2015, our total capital expenditures were approximately $2.3 billion, including drilling and completion costs of $1.7 billion, gathering and compression project costs incurred by Antero Midstream of $320 million, water handling and treatment costs of $131 million (a portion of which were expenditures by Antero Midstream), leasehold acquisition costs of $199 million, and other capital expenditures of $7 million. Our capital budget for 2016 is $1.4 billion, excluding the capital budget for Antero Midstream, and includes: $1.3 billion for drilling and completion and $100 million for core leasehold acreage acquisitions. We do not budget for acquisitions. Approximately 75% of the drilling and completion budget is allocated to the Marcellus Shale and the remaining 25% is allocated to the Utica Shale. During 2016, we plan to operate an average of 5 drilling rigs in the Marcellus Shale and 2 drilling rigs in the Utica Shale. Additionally, the capital budget of Antero Midstream for 2016 is approximately $435 million. We periodically review our capital expenditures and adjust our budget and its allocation based on liquidity, drilling results, leasehold acquisition opportunities, and commodity prices.
We believe that funds from operating cash flows and available borrowings under our revolving credit facility, or capital market transactions, will be sufficient to meet our cash requirements, including normal operating needs, debt service obligations, capital expenditures, and commitments and contingencies for at least the next 12 months. For more information on our outstanding indebtedness, see “—Debt Agreements and Contractual Obligations.”
Cash Flows
The following table summarizes our cash flows for the years ended December 31, 2013, 2014, and 2015:
|
|
|
|
|
|
|
|
|
|
|
|
|
|
|
Year Ended December 31,
|
|
|
(in thousands)
|
|
2013
|
|
2014
|
|
2015
|
|
|
Net cash provided by operating activities
|
|
$
|
534,707
|
|
|
998,121
|
|
|
1,006,381
|
|
|
Net cash used in investing activities
|
|
|
(2,673,592)
|
|
|
(4,089,650)
|
|
|
(2,298,159)
|
|
|
Net cash provided by financing activities
|
|
|
2,137,383
|
|
|
3,320,021
|
|
|
1,069,272
|
|
|
Net increase (decrease) in cash and cash equivalents
|
|
$
|
(1,502)
|
|
|
228,492
|
|
|
(222,506)
|
|
Cash Flow Provided by Operating Activities
Net cash provided by operating activities was $535 million, $998 million and $1.0 billion for the years ended December 31, 2013, 2014 and 2015, respectively. The increase in cash flows from operations from 2013 to 2014 and also from 2014 to 2015 was primarily the result of increases in total realized revenues from production and settled derivatives, net of increases in cash operating costs, interest expense, and changes in working capital levels.
Our operating cash flow is sensitive to many variables, the most significant of which is the volatility of natural gas, NGLs, and oil prices, as well as volatility in the cash flows attributable to settlement of our commodity derivatives. Prices for natural gas, NGLs, and oil are determined primarily by prevailing market conditions. Regional and worldwide economic activity, weather, infrastructure capacity to reach markets, and other variables influence the market conditions for these products. These factors are beyond our control and are difficult to predict. For additional information on the impact of changing prices on our financial position, see “Item 7A. Quantitative and Qualitative Disclosures About Market Risk.”
Cash Flow Used in Investing Activities
During the years ended December 31, 2013, 2014, and 2015, we used cash flows in investing activities of $2.7 billion, $4.1 billion, and $2.3 billion, respectively, as a result of our capital expenditures for drilling, development, acquisitions, and construction of midstream and water handling and treatment infrastructure.
Our board of directors has approved a capital budget of $1.4 billion for 2016, which does not include the capital budget of approximately $435 million for Antero Midstream, our consolidated subsidiary. Our capital budget may be adjusted as business conditions warrant. The amount, timing, and allocation of capital expenditures is largely discretionary and within our control. If natural gas, NGLs, and oil prices decline to levels below our acceptable levels, or costs increase to levels above our acceptable levels, we could choose to defer a significant portion of our budgeted capital expenditures until later periods to achieve the desired balance between sources and uses of liquidity, and to prioritize capital projects that we believe have the highest expected returns and potential to generate near‑term cash flow. We routinely monitor and adjust our capital expenditures in response to changes in commodity prices, availability of financing, drilling and acquisition costs, industry conditions, the timing of regulatory approvals, the availability of rigs, success or lack of success in drilling activities, contractual obligations, internally generated cash flow, and other factors both within and outside our control.
Cash Flow Provided by Financing Activities
Net cash provided by financing activities in 2013 of $2.1 billion was primarily the result of (i) proceeds from our IPO of $1.6 billion, (ii) proceeds from the issuance of senior notes of $1.2 billion, net of (iii) $744 million for retirements of senior notes and payments for early redemption premiums and deferred financing costs.
Net cash provided by financing activities in 2014 of $3.3 billion was primarily the result of (i) proceeds from the issuance of senior notes of $1.1 billion, (ii) net borrowings on our credit facilities of $1.4 billion, (iii) proceeds from the Antero Midstream IPO of $1.1 billion, net of (iv) $309 for retirements of senior notes and payments for early redemption premiums and deferred financing costs. The increase in cash and cash equivalents of $228 million in 2014 is primarily due to cash retained by Antero Midstream subsequent to its IPO. Antero Midstream had a cash balance of $230 million as of December 31, 2014.
Net cash provided by financing activities in 2015 of $1.1 billion was primarily the result of (i) proceeds from the issuance of senior notes of $750 million, (ii) proceeds from the issuance of common stock of $538 million (iii) proceeds from the issuance of common units in Antero Midstream of $241 million, net of (iv) repayments on our credit facilities of $403 million, (v) $34 million for distributions to noncontrolling interest owners in Antero Midstream, and (vi) other items totaling $22 million.
The overall decrease in cash and cash equivalents of $223 million in 2015 is primarily due to capital expenditures by Antero Midstream using proceeds retained from its IPO in 2015. Antero Midstream had a cash balance of $230 million as of December 31, 2014 and $7 million as of December 31, 2015
Debt Agreements and Contractual Obligations
Senior Secured Revolving Credit Facility. We have a senior secured revolving bank credit facility (the “Credit Facility”) with a consortium of bank lenders. Borrowings under the Credit Facility are subject to borrowing base limitations based on the collateral value of our proved properties and commodity hedge positions and are subject to regular semiannual redeterminations. At December 31, 2015, the borrowing base was $4.5 billion and lender commitments were $4.0 billion. The next redetermination of the borrowing base is scheduled to occur in April 2016. At December 31, 2015, we had $707 million of borrowings and $702 million of letters of credit outstanding under the Credit Facility, with a weighted average interest rate of 2.32%. At December 31, 2014, we had $1.7 billion of borrowings and $387 million of letters of credit outstanding under the Credit Facility, with a weighted average interest rate of 2.06%. The Credit Facility matures on May 5, 2019.
On November 10, 2014, the Company and Antero Water, a then-wholly-owned subsidiary of the Company, entered into a new water credit facility in order to provide for separate borrowings attributable to our water handling and treatment business. The water facility was repaid in full and terminated on September 23, 2015, in connection with the contribution of our water handling and treatment business to Antero Midstream.
Principal amounts borrowed on the Credit Facility are payable on the maturity dates with such borrowings bearing interest that is payable quarterly or, in the case of Eurodollar Rate Loans, at the end of the applicable interest period if shorter than three months. We have a choice of borrowing in Eurodollars or at the base rate. Eurodollar loans bear interest at a rate per annum equal to the LIBOR Rate administered by the ICE Benchmark Administration for one, two, three, six or twelve months plus an applicable margin ranging from 150 to 250 basis points, depending on the percentage of our borrowing base utilized. Base rate loans bear interest at a rate per annum equal to the greatest of (i) the agent bank’s reference rate, (ii) the federal funds effective rate plus 50 basis points, and (iii) the rate for one month Eurodollar loans plus 100 basis points, plus an applicable margin ranging from 50 to 150 basis points, depending on the percentage of our borrowing base utilized. The amounts outstanding under the Credit Facility are secured by a first priority lien on substantially all of our natural gas, NGLs, and oil properties and associated assets and are cross‑guaranteed by each borrower entity along with each of their current and future wholly-owned subsidiaries. For information concerning the effect of changes in interest rates on interest payments under these facilities, see “Item 7A. Quantitative and Qualitative Disclosure About Market Risk.”
The Credit Facility contains restrictive covenants that may limit our ability to, among other things:
|
·
| |
incur additional indebtedness; |
|
·
| |
hedge future production; |
|
·
| |
engage in certain other transactions without the prior consent of the lenders. |
The Credit Facility also requires us to maintain the following two financial ratios:
|
·
| |
a current ratio, which is the ratio of our consolidated current assets (including any unused borrowing base under the facilities and excluding derivative assets) to our consolidated current liabilities, of not less than 1.0 to 1.0 as of the end of each fiscal quarter; and |
|
·
| |
a minimum interest coverage ratio, which is the ratio of consolidated EBITDAX to consolidated interest expense over the most recent four quarters, of not less than 2.5 to 1.0. |
We were in compliance with such covenants and ratios as of December 31, 2014 and December 31, 2015. The actual borrowing capacity available to us may be limited by these current ratio and minimum interest coverage ratio covenants. At December 31, 2015, our current ratio was 4.91 to 1.0 (based on the $4.5 billion borrowing base as of December 31, 2015) and our interest coverage ratio was 4.93 to 1.0.
Midstream Credit Facility. On November 10, 2014, in connection with the closing of its IPO, Antero Midstream entered into a new revolving credit facility (the “Midstream Facility”) among Antero Midstream, certain lenders party thereto, and Wells Fargo Bank, National Association, as administrative agent, letter of credit issuer, and swing line lender. The Midstream Facility provides for lender commitments of $1.5 billion and for a letter of credit sublimit of $150 million. There were no borrowings or letters of credit outstanding under the Midstream Facility at December 31, 2014. As of December 31, 2015, Antero Midstream had a total outstanding balance under the Midstream Facility of $620 million, with a weighted average interest rate of 1.92%. The Midstream Facility will mature on November 10, 2019.
Principal amounts borrowed are payable on the maturity date with such borrowings bearing interest that is payable quarterly. Antero Midstream has a choice of borrowing in Eurodollars or at the base rate. Eurodollar loans bear interest at a rate per annum equal to the LIBOR Rate administered by the ICE Benchmark Administration for one, two, three, six or twelve months plus an applicable margin ranging from 150 to 225 basis points, depending on the leverage ratio then in effect. Base rate loans bear interest at a rate per annum equal to the greatest of (i) the agent bank’s reference rate, (ii) the federal funds effective rate plus 50 basis points and (iii) the rate for one month Eurodollar loans plus 100 basis points, plus an applicable margin ranging from 50 to 125 basis points, depending on the leverage ratio then in effect.
The Midstream Facility is secured by mortgages on substantially all of Antero Midstream’s and its restricted subsidiaries’ properties – primarily assets used in the provision of gathering and compression services and water handling and treatment services to Antero and third parties – and guarantees from its restricted subsidiaries. The Midstream Facility is not guaranteed by Antero. Interest is payable at a variable rate based on LIBOR or the prime rate based on Antero Midstream’s election at the time of borrowing. The Midstream Facility contains restrictive covenants that may limit Antero Midstream’s ability to, among other things:
|
·
| |
incur additional indebtedness; |
|
·
| |
make certain restricted payments; |
|
·
| |
engage in certain other transactions without the prior consent of the lenders. |
Borrowings under the Midstream Facility also require Antero Midstream to maintain the following financial ratios:
|
·
| |
an interest coverage ratio, which is the ratio of Antero Midstream’s consolidated EBITDA to its consolidated current interest charges of at least 2.5 to 1.0 at the end of each fiscal quarter; provided that upon obtaining an investment grade rating, the borrower may elect not to be subject to such ratio; |
|
·
| |
a consolidated total leverage ratio, which is the ratio of consolidated debt to consolidated EBITDA (annualized until the fiscal quarter ending September 30, 2016), of not more than 5.50 to 1.00 for the fiscal quarter ending December 31, 2015, of not more than 5.25 to 1.00 for the fiscal quarter ending March 31, 2016, and of not more than 5.00 to 1.00 for the fiscal quarter ending June 30, 2016 and each fiscal quarter thereafter; provided that after electing to issue unsecured high yield notes, the consolidated total leverage ratio will not be more than 5.25 to 1.0, or, following the election of the borrower for two fiscal quarters after a material acquisition, 5.50 to 1.0; and |
|
·
| |
if Antero Midstream elects to issue unsecured high yield notes, a consolidated senior secured leverage ratio, which is the ratio of consolidated senior secured debt to consolidated EBITDA, of not more than 3.75 to 1.0. |
Antero Midstream was in compliance with such covenants and ratios as of December 31, 2014 and December 31, 2015.
Senior Notes. We have $525 million of 6.00% senior notes outstanding, which are due December 1, 2020. The 2020 notes are unsecured and effectively subordinated to the Credit Facility to the extent of the value of the collateral securing the Credit Facility. The 2020 notes rank pari passu to our other outstanding senior notes. The 2020 notes are guaranteed on a senior unsecured basis by our wholly-owned subsidiaries and certain of our future restricted subsidiaries. Interest on the 2020 notes is payable on June 1 and December 1 of each year. We may redeem all or part of the 2020 notes at any time on or after December 1, 2015 at redemption prices ranging from 104.50% currently to 100.00% on or after December 1, 2018. If we undergo a change of control, the holders of the 2020 notes will have the right to require us to repurchase all or a portion of the notes at a price equal to 101% of the principal amount of the 2020 notes, plus accrued interest.
We also have $1.0 billion of 5.375% senior notes outstanding, which are due November 1, 2021. The 2021 notes are unsecured and effectively subordinated to the Credit Facility to the extent of the value of the collateral securing the Credit Facility. The 2021 notes rank parri passu to our other outstanding senior notes. The 2021 notes are guaranteed by our wholly-owned subsidiaries and certain of our future restricted subsidiaries. Interest on the 2021 notes is payable on May 1 and November 1 of each year. We may redeem all or part of the 2021 notes at any time on or after November 1, 2016 at redemption prices ranging from 104.031% on or after November 1, 2016 to 100.00% on or after November 1, 2019. In addition, on or before November 1, 2016, we may redeem up to 35% of the aggregate principal amount of the 2021 notes with the net cash proceeds of certain equity offerings, if certain conditions are met, at a redemption price of 105.375%. At any time prior to November 1, 2016, we may also redeem the 2021 notes, in whole or in part, at a price equal to 100% of the principal amount of the 2021 notes plus a “make-whole” premium and accrued interest. If we undergo a change of control, we may be required to offer to purchase the 2021 notes from the holders at a price equal to 101% of the principal amount of the 2021 notes, plus accrued interest.
We also have $1.1 billion of 5.125% senior notes outstanding, which are due December 1, 2022. The 2022 notes are unsecured and effectively subordinated to the Credit Facility to the extent of the value of the collateral securing the Credit Facility. The 2022 notes rank parri passu to our other outstanding senior notes. The 2022 notes are guaranteed by our wholly-owned subsidiaries and certain of our future restricted subsidiaries. Interest on the 2022 notes is payable on June 1 and December 1 of each year. We may redeem all or part of the 2022 notes at any time on or after June 1, 2017 at redemption prices ranging from 103.844% on or after June 1, 2017 to 100.00% on or after June 1, 2020. In addition, on or before June 1, 2017, we may redeem up to 35% of the aggregate principal amount of the 2022 notes with the net cash proceeds of certain equity offerings, if certain conditions are met, at a
redemption price of 105.125%. At any time prior to June 1, 2017, we may also redeem the 2022 notes, in whole or in part, at a price equal to 100% of the principal amount of the 2022 notes plus a “make-whole” premium and accrued interest. If we undergo a change of control, the holders of the 2022 notes will have the right to require us to repurchase all or a portion of the notes at a price equal to 101% of the principal amount of the 2022 notes, plus accrued interest.
We also have $750 million of 5.625% senior notes outstanding, which are due June 1, 2023. The 2023 notes are unsecured and effectively subordinated to the Credit Facility to the extent of the value of the collateral securing the Credit Facility. The 2023 notes rank parri passu to our other outstanding senior notes. The 2023 notes are guaranteed by our wholly-owned subsidiaries and certain of our future restricted subsidiaries. Interest on the 2023 notes is payable on June 1 and December 1 of each year. We may redeem all or part of the 2023 notes at any time on or after June 1, 2018 at redemption prices ranging from 104.219% on or after June 1, 2018 to 100.00% on or after June 1, 2021. In addition, on or before June 1, 2018, we may redeem up to 35% of the aggregate principal amount of the 2023 notes with the net cash proceeds of certain equity offerings, if certain conditions are met, at a redemption price of 105.625%. At any time prior to June 1, 2018, we may also redeem the 2023 notes, in whole or in part, at a price equal to 100% of the principal amount of the 2023 notes plus a “make-whole” premium and accrued interest. If we undergo a change of control prior to June 1, 2016, we may redeem all, but not less than all, of the 2023 notes at a redemption price equal to 110% of the principal amount of the 2023 notes. If we undergo a change of control, the holders of the 2023 notes will have the right to require us to repurchase all or a portion of the notes at a price equal to 101% of the principal amount of the 2023 notes, plus accrued interest.
We used the proceeds from the issuances of the senior notes to repay borrowings outstanding under the Credit Facility, redeem previously issued senior notes, and for development of our oil and natural gas properties.
The senior notes indentures each contain restrictive covenants and restrict our ability to incur additional debt unless a pro forma minimum interest coverage ratio requirement of 2.25:1 is maintained. We were in compliance with such covenants as of December 31, 2014 and December 31, 2015.
We may, from time to time, seek to retire or purchase our outstanding debt through cash purchases and/or exchanges for equity securities, in open market purchases, privately negotiated transactions or otherwise. Such repurchases or exchanges, if any, will depend on prevailing market conditions, our liquidity requirements, contractual restrictions and other factors. The amounts involved may be material.
Treasury Management Facility. We have a stand-alone revolving note with a lender under the Credit Facility which provides for up to $25 million of cash management obligations in order to facilitate our daily treasury management. Borrowings under the revolving note are secured by the collateral for the Credit Facility. Borrowings under the facility bear interest at the lender’s prime rate plus 1.0%. The note matures on May 1, 2016. At December 31, 2014 and December 31, 2015, there were no outstanding borrowings under this facility.
Contractual Obligations. A summary of our contractual obligations as of December 31, 2015 is provided in the table below. Contractual obligations listed exclude minimum fees that we will pay to Antero Midstream, our consolidated subsidiary, under gathering, compression, and water services agreements.
|
|
|
|
|
|
|
|
|
|
|
|
|
|
|
|
|
|
|
|
|
|
|
|
|
|
|
Year Ended December 31,
|
|
|
(in millions)
|
|
2016
|
|
2017
|
|
2018
|
|
2019
|
|
2020
|
|
Thereafter
|
|
Total
|
|
|
Credit Facility(1)
|
|
$
|
—
|
|
|
—
|
|
|
—
|
|
|
707
|
|
|
—
|
|
|
—
|
|
|
707
|
|
|
Antero Midstream Partners LP Facility(1)
|
|
|
—
|
|
|
—
|
|
|
—
|
|
|
620
|
|
|
—
|
|
|
—
|
|
|
620
|
|
|
Senior notes—principal(2)
|
|
|
—
|
|
|
—
|
|
|
—
|
|
|
—
|
|
|
525
|
|
|
2,850
|
|
|
3,375
|
|
|
Senior notes—interest(2)
|
|
|
184
|
|
|
184
|
|
|
184
|
|
|
184
|
|
|
184
|
|
|
244
|
|
|
1,164
|
|
|
Drilling rig and frac service commitments(3)
|
|
|
171
|
|
|
104
|
|
|
4
|
|
|
—
|
|
|
—
|
|
|
—
|
|
|
279
|
|
|
Firm transportation (4)
|
|
|
522
|
|
|
729
|
|
|
900
|
|
|
1,060
|
|
|
1,079
|
|
|
11,004
|
|
|
15,294
|
|
|
Processing, gathering, and compression services (5)
|
|
|
320
|
|
|
344
|
|
|
242
|
|
|
186
|
|
|
186
|
|
|
861
|
|
|
2,139
|
|
|
Office and equipment leases
|
|
|
13
|
|
|
14
|
|
|
24
|
|
|
22
|
|
|
20
|
|
|
171
|
|
|
264
|
|
|
Asset retirement obligations(6)
|
|
|
—
|
|
|
—
|
|
|
—
|
|
|
—
|
|
|
—
|
|
|
31
|
|
|
31
|
|
|
Total
|
|
$
|
1,210
|
|
|
1,375
|
|
|
1,354
|
|
|
2,779
|
|
|
1,994
|
|
|
15,161
|
|
|
23,873
|
|
|
(1)
| |
Includes outstanding principal amounts at December 31, 2015. This table does not include future commitment fees, interest expense or other fees on our Credit Facility or the Midstream Facility because they are floating rate instruments and we cannot determine with accuracy the timing of future loan advances, repayments, or future interest rates to be charged. |
|
(2)
| |
Includes the 6.00% notes due 2020, the 5.375% notes due 2021, the 5.125% notes due 2022, and the 5.625% notes due 2023. |
|
(3)
| |
Includes contracts for the services of drilling rigs and hydraulic fracturing fleets, which expire at various dates from March 2016 through July 2018. The values in the table represent the gross amounts that we are committed to pay; however, we will record in our financial statements our proportionate share of costs based on our working interest. |
|
(4)
| |
Includes firm transportation agreements with various pipelines in order to facilitate the delivery of production to market. These contracts commit us to transport minimum daily natural gas or NGLs volumes at negotiated rates, or pay for any deficiencies at specified reservation fee rates. The amounts in this table represent our minimum daily volumes at the reservation fee rate. The values in the table represent the gross amounts that we are committed to pay; however, we will record in our financial statements our proportionate share of costs based on our working interest. |
|
(5)
| |
Contractual commitments for processing, gathering and compression services agreements represent minimum commitments under long-term agreements. The values in the table represent the gross amounts that we are committed to pay; however, we will record in our financial statements our proportionate share of costs based on our working interest. |
|
(6)
| |
Represents the present value of our estimated asset retirement obligations. Neither the ultimate settlement amounts nor the timing of our asset retirement obligations can be precisely determined in advance; however, we believe it is likely that a very small amount of these obligations will be settled within the next five years. |
Critical Accounting Policies and Estimates
The discussion and analysis of our financial condition and results of operations are based upon our consolidated financial statements, which have been prepared in accordance with GAAP. The preparation of our financial statements requires us to make estimates and assumptions that affect the reported amounts of assets, liabilities, revenues and expenses, and related disclosure of contingent assets and liabilities. Certain accounting policies involve judgments and uncertainties to such an extent that there is reasonable likelihood that materially different amounts could have been reported under different conditions, or if different assumptions had been used. We evaluate our estimates and assumptions on a regular basis. We base our estimates on historical experience and various other assumptions that are believed to be reasonable under the circumstances, the results of which form the basis for making judgments about the carrying values of assets and liabilities that are not readily apparent from other sources. Actual results may differ from these estimates and assumptions used in preparation of our consolidated financial statements. Our more significant accounting policies and estimates include the successful efforts method of accounting for our production activities, estimates of natural gas, NGLS, and oil reserve quantities and standardized measures of future cash flows, and impairment of proved properties. We provide an expanded discussion of our more significant accounting policies, estimates and judgments below. We believe these accounting policies reflect our more significant estimates and assumptions used in the preparation of our consolidated financial statements. See note 2 to the consolidated financial statements for a discussion of additional accounting policies and estimates made by management.
Successful Efforts Method
The Company accounts for its natural gas, NGLs, and crude oil exploration and development activities under the successful efforts method of accounting. Under the successful efforts method, the costs incurred to acquire, drill, and complete productive wells, development wells, and undeveloped leases are capitalized. Oil and gas lease acquisition costs are also capitalized. Exploration costs, including personnel and other internal costs, geological and geophysical expenses, delay rentals for gas and oil leases, and costs associated with unsuccessful lease acquisitions are charged to expense as incurred. Exploratory drilling costs are initially capitalized, but charged to expense if and when we determine that the well does not contain reserves in commercially viable quantities. The Company reviews exploration costs related to wells in progress at the end of each quarter and makes a determination, based on known results of drilling at that time, whether the costs should continue to be capitalized pending further well testing and results, or charged to expense. We have not incurred any such charges in the years ended December 31, 2013, 2014, and 2015. The sale of a partial interest in a proved property is accounted for as a cost recovery, and no gain or loss is recognized as long as this treatment does not significantly affect the units of production amortization rate. A gain or loss is recognized for all other sales of producing properties.
Unproved properties with significant acquisition costs are assessed for impairment on a property by property basis, and any impairment in value is charged to expense. Impairment is assessed based on remaining lease terms, drilling results, reservoir performance, commodity price outlooks, and future plans to develop acreage. Unproved properties and the related costs are transferred to proved properties when reserves are discovered on, or otherwise attributed to, the property. Proceeds from sales of
partial interests in unproved properties are accounted for as a recovery of cost without recognition of any gain or loss until the cost has been recovered. Impairment of unproved properties for leases which have expired, or are expected to expire, was $10.9 million, $15.2 million, and $104.3 million for the years ended December 31, 2013, 2014, and 2015, respectively.
The successful efforts method of accounting can have a significant impact on our operational results when we are entering a new exploratory area in anticipation of finding a gas and oil field that will be the focus of future development drilling activities. The initial exploratory wells may be unsuccessful and will be expensed if reserves are not found in economic quantities. Seismic costs can be substantial, which will result in additional exploration expenses when incurred. Additionally, the application of the successful efforts method of accounting requires managerial judgment to determine the proper classification of wells designated as developmental or exploratory, which will ultimately determine the proper accounting treatment of the costs incurred.
Natural Gas, NGLs and Oil Reserve Quantities and Standardized Measure of Future Cash Flows
Our internal technical staff prepares the estimates of natural gas, NGLs, and oil reserves and associated future net cash flows, which are audited by our independent reserve engineers. Current accounting guidance allows only proved natural gas, NGLs, and oil reserves to be included in our financial statement disclosures. The SEC has defined proved reserves as the estimated quantities of natural gas, NGLs, and oil which geological and engineering data demonstrate with reasonable certainty to be recoverable in future years from known reservoirs under existing economic and operating conditions. Our independent reserve engineers and internal technical staff must make a number of subjective assumptions based on their professional judgment in developing reserve estimates. Reserve estimates consider recent production levels and other technical information about each field. Natural gas, NGLs, and oil reserve engineering is a subjective process of estimating underground accumulations of natural gas, NGLs, and oil that cannot be precisely measured. The accuracy of any reserve estimate is a function of the quality of available data and of engineering and geological interpretation and judgment. Periodic revisions to the estimated reserves and future cash flows may be necessary as a result of a number of factors, including reservoir performance, new drilling, natural gas, NGLs, and oil prices, cost changes, technological advances, new geological or geophysical data, or other economic factors. Accordingly, reserve estimates are generally different from the quantities of natural gas, NGLs, and oil that are ultimately recovered. We cannot predict the amounts or timing of future reserve revisions. If such revisions are significant, they could significantly affect the future amortization rates of capitalized costs and result in asset impairments that may be material.
Impairment of Proved Properties
We evaluate the carrying amount of our proved natural gas, NGLs, and oil properties for impairment on a geological reservoir basis whenever events or changes in circumstances indicate that a property’s carrying amount may not be recoverable. Under GAAP for successful efforts accounting, if the carrying amount exceeds the estimated undiscounted future net cash flows (measured using future prices), we would estimate the fair value of our properties and record an impairment charge for any excess of the carrying amount of the properties over the estimated fair value of the properties. Given the rapid decline in the market prices of natural gas, NGLs, and oil that occurred during the fourth quarter of 2014 and continued in 2015, at December 31, 2014 and at the end of each quarter during 2015 we compared estimated undiscounted future cash flows using futures pricing for our Utica and Marcellus Basin properties to the carrying value of those properties. Estimated undiscounted future cash flows have exceeded the carrying value at the end of each quarter, including at December 31, 2015, and thus, no further evaluation of the fair value of the properties for impairment is required under GAAP. As a result, we have not recorded any impairment expenses associated with our Utica and Marcellus Basin proved properties during the year ended December 31, 2015. Additionally, we did not record any impairment expenses for proved properties during the years ended December 31, 2013 and 2014.
Based on current future commodity prices, we currently do not anticipate having to record any impairment charge for our proved properties in the near future. We estimate that if future prices were to decline for gas by $0.50 to $0.75 per Mcf and for oil by $5.00 to $7.50 per barrel from future pricing levels at December 31, 2015, estimated future net revenues for our Utica properties would approximate the carrying amount of the properties and further evaluation of the fair value of those properties would be required in order to determine if an impairment charge would be necessary under GAAP. For our Marcellus properties, strip pricing would have to decline by more than $0.75 per Mcf and $7.50 per barrel of oil from year end 2015 levels before further evaluation of those properties would be required in order to determine if an impairment charge would be necessary under GAAP. We are unable, however, to predict commodity prices with any greater precision than the futures market.
Income Taxes
We are subject to state and federal income taxes, but are currently not in a tax paying position for regular federal income
taxes, primarily due to the differences in the tax and financial statement treatment of oil and gas properties, and the deferral of unsettled commodity hedge gains for tax purposes until they are settled in an exchange of cash. Our deferred tax assets and liabilities result from temporary differences between tax and financial statement income, primarily from derivatives, oil and gas properties, and net operating loss carryforwards. We have generated net operating loss carryforwards that expire at various dates from 2024 through 2035, which resulted in the recognition of significant deferred tax assets. We record deferred income tax expense to the extent our deferred tax liabilities exceed our deferred tax assets. We record a deferred income tax benefit to the extent our deferred tax assets exceed our deferred tax liabilities.
We record a valuation allowance when we believe all or a portion of our deferred tax assets will not be realized. In assessing the realizability of our deferred tax assets, management considers whether some portion or all of the deferred tax assets will be realized based on a more-likely-than-not standard of judgment. The ultimate realization of deferred tax assets is dependent upon our ability to generate future taxable income during the periods in which our deferred tax assets are deductible. Management considers the scheduled reversal of deferred tax liabilities, projected future taxable income, and tax planning strategies in making this assessment, estimates of which may be imprecise due to unforeseen future events or conditions outside of our control, including changes in commodity prices or changes to tax laws and regulations. The amount of deferred tax assets considered realizable could change based upon the amounts of taxable income actually generated, or as estimates of future taxable income change. As of December 31, 2015, we have recognized a valuation allowance of $27 million for net operating loss carryforwards we do not expect to realize that are primarily attributable to states in which we no longer operate.
The calculation of deferred tax assets and liabilities involves uncertainties in the application of complex tax laws and regulations. We recognize in our financial statements those tax positions which we believe are more-likely-than-not to be sustained upon examination by the Internal Revenue Service or state revenue authorities. At December 31, 2015, our financial statements include unrecognized benefits of $11 million that, if recognized, would result in a reduction of current income taxes payable and an increase in noncurrent deferred tax liabilities.
As of December 31, 2015, we have elected to early adopt ASU No. 2015-17, Income Taxes–Balance Sheet Classification of Deferred Taxes. Please see footnote 2(u) to our consolidated financial statements for a discussion of the impact of this standard on our ongoing financial reporting.
New Accounting Pronouncements
On May 28, 2014, the FASB issued Accounting Standards Update (“ASU”) No. 2014-09, Revenue from Contracts with Customers, which requires an entity to recognize the amount of revenue to which it expects to be entitled for the transfer of promised goods or services to customers. The ASU will replace most existing revenue recognition guidance in U.S. GAAP when it becomes effective. The new standard becomes effective for the Company on January 1, 2018. Early application is not permitted. The standard permits the use of either the retrospective or cumulative effect transition method. The Company is evaluating the effect that ASU 2014-09 will have on its consolidated financial statements and related disclosures. The Company has not yet selected a transition method nor has it determined the effect of the standard on its ongoing financial reporting.
On April 7, 2015, the FASB issued ASU No. 2015-03, Interest–Imputation of Interest, which requires debt issuance costs to be presented in the balance sheet as a direct deduction from the associated debt liability. The new standard became effective for the Company on January 1, 2016, and will be adopted in its Form 10-Q filing in the first quarter of 2016. The Company does not believe that this standard will have a material impact on its ongoing financial reporting upon adoption.
Off‑Balance Sheet Arrangements
As of December 31, 2015, we did not have any off‑balance sheet arrangements other than operating leases and contractual commitments for drilling rig and hydraulic fracturing services, firm transportation, gas processing, and gathering and compression services. See “—Debt Agreements and Contractual Obligations—Contractual Obligations” for commitments under operating leases, drilling rig and hydraulic fracturing service agreements, firm transportation, gas processing, and gathering and compression service agreements.
Item 7A. Quantitative and Qualitative Disclosures About Market Risk
The primary objective of the following information is to provide forward‑looking quantitative and qualitative information about our potential exposure to market risk. The term “market risk” refers to the risk of loss arising from adverse changes in natural gas, NGLs, and oil prices, as well as interest rates. The disclosures are not meant to be precise indicators of expected future losses, but rather indicators of reasonably possible losses. This forward‑looking information provides indicators of how we view and manage our ongoing market risk exposures. All of our market risk sensitive instruments were entered into for hedging purposes, rather than for speculative trading.
Commodity Hedging Activities
Our primary market risk exposure is in the price we receive for our natural gas, NGLs, and oil production. Realized pricing is primarily driven by spot regional market prices applicable to our U.S. natural gas production and the prevailing worldwide price for crude oil. Pricing for natural gas, NGLs, and oil production has, historically, been volatile and unpredictable, and we expect this volatility to continue in the future. The prices we receive for production depend on many factors outside of our control, including volatility in the differences between product prices at sales points and the applicable index price.
To mitigate some of the potential negative impact on our cash flow caused by changes in commodity prices, we enter into derivative instruments to receive fixed prices for a portion of our natural gas, NGLs, and oil production when management believes that favorable future prices can be secured. We hedge part of our production at fixed prices for our sales points to mitigate the risk of differentials to the sales point prices. Part of our production is also hedged at NYMEX prices.
Our financial hedging activities are intended to support natural gas, NGLs, and oil prices at targeted levels and to manage our exposure to natural gas, NGLs, and oil price fluctuations. These contracts may include commodity price swaps whereby we will receive a fixed price for our production and pay a variable market price to the contract counterparty, cashless price collars that set a floor and ceiling price for the hedged production, or basis differential swaps. These contracts are financial instruments, and do not require or allow for physical delivery. Under the commodity price swaps contracts, the counterparty is required to make a payment to us for the difference between the fixed price and the settlement price if the settlement price is below the fixed price. We are required to make a payment to the counterparty for the difference between the fixed price and the settlement price if the fixed price is below the settlement price. If the applicable monthly price indices are outside of the ranges set by the floor and ceiling prices in the various collars, we and the counterparty to the collars would be required to settle the difference. The Company was not party to any collars as of, or during the year ended, December 31, 2015.
At December 31, 2015, we had in place natural gas and propane swaps covering portions of our projected production from 2016 through 2022. Our commodity hedge position as of December 31, 2015 is summarized in note 10 to our consolidated financial statements included elsewhere herein. The Credit Facility allows us to hedge up to 75% of our projected production for the next five years, and 65% of our subsequent estimated proved reserves through December 31, 2022. Based on our production and our fixed price swap contracts in place during 2015, our income before taxes for the year ended December 31, 2015 would have decreased by approximately $10 million for each $0.10 decrease per MMBtu in natural gas prices and $1.00 decrease per Bbl in oil and NGLs prices.
All derivative instruments, other than those that meet the normal purchase and normal sales exception, are recorded at fair market value in accordance with GAAP and are included in our consolidated balance sheets as assets or liabilities. The fair values of our derivative instruments are adjusted for non‑performance risk. Because we do not designate these derivatives as accounting hedges, they do not receive hedge accounting treatment; therefore, all mark‑to‑market gains or losses, as well as cash receipts or payments on settled derivative instruments, are recognized in our statements of operations. We present total gains or losses on commodity derivatives (both settled derivatives and derivative positions which remain open) in our operating revenues as “Commodity derivative fair value gains.”
Mark‑to‑market adjustments of derivative instruments cause earnings volatility but have no cash flow impact relative to changes in market prices until the derivative contracts are settled. We expect continued volatility in the fair value of our derivative instruments. Our cash flows are only impacted when the associated derivative instrument contracts are settled by making or receiving payments to or from the counterparty. At December 31, 2014 and 2015, the estimated fair value of our commodity derivative instruments was a net asset of $1.6 billion and $3.1 billion, respectively, comprised of current and noncurrent assets. None of these commodity derivative instruments were entered into for trading or speculative purposes.
By removing price volatility from a portion of our expected production through December 2022, we have mitigated, but not eliminated, the potential effects of changing prices on our operating cash flows for those periods. While mitigating negative effects of falling commodity prices, these derivative contracts also limit the benefits we would receive from increases in commodity prices above the fixed hedge prices.
Counterparty and Customer Credit Risk
Our principal exposures to credit risk are through receivables resulting from commodity derivatives contracts ($3.1 billion at December 31, 2015), the sale of our oil and gas production ($124 million at December 31, 2015) which we market to energy companies, end users and refineries, and joint interest receivables ($35 million at December 31, 2015).
By using derivative instruments that are not traded on an exchange to hedge exposures to changes in commodity prices, we expose ourselves to the credit risk of our counterparties. Credit risk is the potential failure of the counterparty to perform under the terms of the derivative contract. When the fair value of a derivative contract is positive, the counterparty is expected to owe us, which creates credit risk. To minimize the credit risk in derivative instruments, it is our policy to enter into derivative contracts only with counterparties that are creditworthy financial institutions which management deems to be competent and competitive market makers. The creditworthiness of our counterparties is subject to periodic review. We have commodity hedges in place with fourteen different counterparties, all of which are lenders under our Credit Facility. The fair value of our commodity derivative contracts of approximately $3.1 billion at December 31, 2015 includes the following values by bank counterparty: Morgan Stanley—$691 million; Barclays—$593 million; JP Morgan—$575 million; Citigroup—$362 million; Wells Fargo—$285 million; Scotiabank—$214 million; BNP Paribas—$188 million; Toronto Dominion Bank—$76 million; Fifth Third Bank—$41 million; Canadian Imperial Bank of Commerce—$37 million; Bank of Montreal—$29 million; SunTrust—$17 million; Capital One—$8 million; and Natixis—$1 million. The credit ratings of certain of these banks were downgraded in recent years because of the sovereign debt crisis in Europe. The estimated fair value of our commodity derivative assets has been risk adjusted using a discount rate based upon the respective published credit default swap rates (if available, or if not available, a discount rate based on the applicable Reuters bond rating) at December 31, 2015 for each of the European and American banks. We believe that all of these institutions currently are acceptable credit risks. Other than as provided by the Credit Facility, we are not required to provide credit support or collateral to any of our counterparties under our derivative contracts, nor are they required to provide credit support to us. As of December 31, 2015, we did not have any past‑due receivables from, or payables to, any of the counterparties to our derivative contracts.
We are also subject to credit risk due to the concentration of our receivables from several significant customers for sales of natural gas, NGLs, and oil. We generally do not require our customers to post collateral. The inability or failure of our significant customers to meet their obligations to us, or their insolvency or liquidation, may adversely affect our financial results.
Joint interest receivables arise from billing entities who own partial interests in the wells we operate. These entities participate in our wells primarily based on their ownership in leased properties on which we drill. We have minimal control over deciding who participates in our wells.
Interest Rate Risks
Our primary exposure to interest rate risk results from outstanding borrowings under our Credit Facility and the Midstream Facility of our consolidated subsidiary, Antero Midstream. Each of these credit facilities has a floating interest rate. The average annual interest rate incurred on this indebtedness during the year ended December 31, 2015 was approximately 2.08%. A 1.0% increase in each of the applicable average interest rates for the year ended December 31, 2015 would have resulted in an estimated $12 million increase in interest expense.
Item 8. Financial Statements and Supplementary Data
The Reports of Independent Registered Public Accounting Firm, Consolidated Financial Statements, and supplementary financial data required for this Item are set forth beginning on page F‑1 of this report and are incorporated herein by reference.
Item 9. Changes in and Disagreements with Accountants on Accounting and Financial Disclosure
Not applicable.
Item 9A. Controls and Procedures
Evaluation of Disclosure Controls and Procedures
As required by Rule 13a‑15(b) under the Securities Exchange Act of 1934, as amended (the “Exchange Act”), we have evaluated, under the supervision and with the participation of our management, including our principal executive officer and principal financial officer, the effectiveness of the design and operation of our disclosure controls and procedures (as defined in Rules 13a‑15(e) and 15d‑15(e) under the Exchange Act) as of the end of the period covered by this annual report. Our disclosure controls and procedures are designed to ensure that information required to be disclosed in the reports that we file or submit under the Exchange Act is recorded, processed, summarized and reported, within the time periods specified in the SEC’s rules and forms. Based upon that evaluation, our principal executive officer and principal financial officer concluded that our disclosure controls and procedures were effective as of December 31, 2015.
Changes in Internal Control Over Financial Reporting
There has been no change in our internal control over financial reporting (as defined in Rules 13a‑15(f) and 15d‑15(f) under the Exchange Act) during the fourth quarter of 2015 that has materially affected, or is reasonably likely to materially affect, our internal control over financial reporting.
Management’s Annual Report on Internal Control Over Financial Reporting
The management of Antero Resources Corporation is responsible for establishing and maintaining adequate internal control over financial reporting for us as defined in Rules 13a‑15(f) and 15d‑15(f) of the Exchange Act. This system is designed to provide reasonable assurance regarding the reliability of financial reporting and the preparation of financial statements for external purposes in accordance with accounting principles generally accepted in the United States of America.
Our internal control over financial reporting includes those policies and procedures that:
|
(i)
| |
pertain to the maintenance of records that, in reasonable detail, accurately and fairly reflect our transactions and dispositions of the assets; |
|
(ii)
| |
provide reasonable assurance that transactions are recorded as necessary to permit preparation of financial statements in accordance with generally accepted accounting principles, and that our receipts and expenditures are being made only in accordance with authorizations of our management and Directors; and |
|
(iii)
| |
provide reasonable assurance regarding prevention or timely detection of unauthorized acquisition, use, or disposition of our assets that could have a material effect on the financial statements. |
Because of its inherent limitations, a system of internal control over financial reporting can provide only reasonable assurance and may not prevent or detect all misstatements. Further, because of changes in conditions, effectiveness of internal controls over financial reporting may vary over time.
Under the supervision of, and with the participation of our management, including the Chief Executive Officer and Chief Financial Officer, we conducted an evaluation of the effectiveness of our internal control over financial reporting based on the framework and criteria established in Internal Control—Integrated Framework in 2013, issued by the Committee of Sponsoring Organizations of the Treadway Commission. Based on this evaluation, management of Antero Resources Corporation concluded that our internal control over financial reporting was effective as of December 31, 2015.
The effectiveness of our internal control over financial reporting as of December 31, 2015 has been audited by KPMG LLP, an independent registered public accounting firm which also audited our consolidated financial statements as of and for the year ended December 31, 2015, as stated in their reports which appear beginning on page F-2 in this report.
Item 9B. Other Information
Disclosure pursuant to Section 13(r) of the Securities Exchange Act of 1934
Pursuant to Section 13(r) of the Securities Exchange Act of 1934, we, Antero Resources Corporation, may be required to disclose in our annual and quarterly reports to the Securities and Exchange Commission (the “SEC”), whether we or any of our “affiliates” knowingly engaged in certain activities, transactions or dealings relating to Iran or with certain individuals or entities targeted by U.S. economic sanctions. Disclosure is generally required even where the activities, transactions or dealings were conducted in compliance with applicable law. Because the SEC defines the term “affiliate” broadly, it includes any entity under common “control” with us (and the term “control” is also construed broadly by the SEC).
The description of the activities below has been provided to us by Warburg Pincus LLC (“WP”), affiliates of which: (i) beneficially own more than 10% of our outstanding common stock and/or are members of our board of directors and (ii) beneficially own more than 10% of the equity interests of, and have the right to designate members of the board of directors of each of Santander Asset Management Investment Holdings Limited (“SAMIH”) and Endurance International Group (“Endurance”). Each of SAMIH and Endurance may therefore be deemed to be under common “control” with us; however, this statement is not meant to be an admission that common control exists.
The disclosure below relates solely to activities conducted by SAMIH, Endurance, and their respective affiliates. The disclosure does not relate to any activities conducted by Antero Resources Corporation or by WP and does not involve our or WP’s management. Neither us nor WP has had any involvement in or control over the disclosed activities, and neither us nor WP has independently verified or participated in the preparation of the disclosure. Neither us nor WP is representing as to the accuracy or completeness of the disclosure nor do we or WP undertake any obligation to correct or update it.
As to EIG
We understand that each of SAMIH’s SEC-reporting affiliates intends to disclose in its next annual or quarterly SEC report that:
(a) Santander UK plc (“Santander UK”) holds frozen savings accounts and one current account for two customers resident in the United Kingdom (“U.K.”) who are currently designated by the United States (“U.S.”) for terrorism. The accounts held by each customer were blocked after the customer’s designation and have remained blocked and dormant throughout 2015. Revenue generated by Santander UK on these accounts is negligible.
(b) An Iranian national, resident in the U.K., who is currently designated by the U.S. under the Iranian Financial Sanctions Regulations and the Weapons of Mass Destruction Proliferators Sanctions Regulations (“NPWMD”), holds a mortgage with Santander UK that was issued prior to any such designation. No further drawdown has been made (or would be allowed) under this mortgage although Santander UK continues to receive repayment installments. In 2015, total revenue in connection with the mortgage was approximately £3,876 while net profits were negligible relative to the overall profits of Santander UK. Santander UK does not intend to enter into any new relationships with this customer, and any disbursements will only be made in accordance with applicable sanctions. The same Iranian national also holds two investment accounts with Santander ISA Managers Limited. The funds within both accounts are invested in the same portfolio fund. The accounts have remained frozen during 2015. The investment returns are being automatically reinvested, and no disbursements have been made to the customer. Total revenue for the Santander group in connection with the investment accounts was approximately £188 while net profits in 2015 were negligible relative to the overall profits of Banco Santander, S.A.
(c) During the third quarter of 2015 two additional Santander UK customers were designated. First, a UK national designated by the U.S. under the Specially Designated Global Terrorist (“SDGT”) sanctions program who is on the U.S. Specially Designated National (“SDN”) list. This customer holds a bank account which generated revenue of approximately £180 during the third and fourth quarter of 2015. The account is blocked. Net profits in the third and fourth quarter of 2015 were negligible relative to the overall profits of Santander. Second, a UK national also designated by the U.S. under the SDGT sanctions program who is on the U.S. SDN list, held a bank account. No transactions were made in the third and fourth quarter of 2015 and the account is blocked and in arrears.
(d) In addition, during the fourth quarter of 2015, Santander UK has identified one additional customer. A UK national designated by the U.S. under the SDGT sanctions program who is on the U.S. SDN list, held a bank account which generated negligible revenue during the fourth quarter of 2015. The account was closed during the fourth quarter of 2015. Net profits in the fourth quarter of 2015 were negligible relative to the overall profits of Banco Santander, S.A.
We understand that Endurance intends to disclose in its next annual or quarterly SEC report that:
On December 2, 2015, Endurance terminated a subscriber account (the “Subscriber Account”) that Endurance believes to be associated with Issam Shammout and Sky Blue Bird Aviation (“Shammout”) identified by the Office of Foreign Assets Control (“OFAC”), as a Specially Designated National (“SDN”), on May 21, 2015, pursuant to 31 C.F.R. Part 594. The Subscriber Account was inadvertently migrated to Endurance’s servers following its acquisition of the assets of Arvixe LLC (“Arvixe”) on October 31, 2014. Pursuant to the terms of the asset purchase agreement between Endurance and Arvixe, any customer accounts prohibited by OFAC were expressly excluded from the acquisition. Accordingly, Endurance does not believe it took legal ownership of the Subscriber Account, and no revenue was collected by Endurance in connection with the Subscriber Account since the date on which Shammout was added to the SDN list. Nonetheless, upon identifying that the Subscriber Account had been migrated to its servers, Endurance promptly suspended all services and terminated the Subscriber Account. Endurance reported the Subscriber Account to OFAC as potentially the property of a SDN subject to blocking pursuant to Executive Order 13224. As of January 25, 2016, Endurance has not received any correspondence from OFAC regarding this matter.
PART III
Item 10. Directors, Executive Officers, and Corporate Governance
Pursuant to General Instruction G(3) to Form 10‑K, we incorporate by reference into this Item the information to be disclosed in our definitive proxy statement for our 2016 Annual Meeting of Stockholders.
Directors and Executive Officers
The following table sets forth names, ages and titles of our directors and executive officers as of February 24, 2016:
|
|
|
|
|
Name
|
Age
|
Title
|
|
Paul M. Rady
|
62
|
Chairman of the Board, Director and Chief Executive Officer
|
|
Glen C. Warren, Jr.
|
60
|
President, Director, Chief Financial Officer and Secretary
|
|
Michael N. Kennedy
|
41
|
Senior Vice President—Finance
|
|
Kevin J. Kilstrom
|
61
|
Senior Vice President—Production
|
|
Ward D. McNeilly
|
65
|
Senior Vice President—Reserves, Planning and Midstream
|
|
Alvyn A. Schopp
|
57
|
Chief Administrative Officer, Regional Senior Vice President and Treasurer
|
|
Robert J. Clark
|
71
|
Director
|
|
Richard W. Connor
|
66
|
Director
|
|
Benjamin A. Hardesty
|
66
|
Director
|
|
Peter R. Kagan
|
47
|
Director
|
|
W. Howard Keenan, Jr.
|
65
|
Director
|
|
James R. Levy
|
39
|
Director
|
|
Christopher R. Manning
|
48
|
Director
|
Set forth below is the description of the backgrounds of our directors and executive officers.
Paul M. Rady has served as Chief Executive Officer and Chairman of the Board of Directors since May 2004. Mr. Rady also served as Chief Executive Officer and Chairman of the Board of Directors of our predecessor company, Antero Resources Corporation, from its founding in 2002 to its ultimate sale to XTO Energy, Inc. in April 2005. Mr. Rady also serves as Chairman of the Board of Directors of the general partner of Antero Midstream Partners LP. Prior to Antero Resources Corporation, Mr. Rady served as President, CEO and Chairman of Pennaco Energy from 1998 until its sale to Marathon in early 2001. Prior to Pennaco, Mr. Rady was with Barrett Resources from 1990 until 1998 where he initially was recruited as Chief Geologist in 1990, then served as Exploration Manager, EVP Exploration, President, COO and Director and ultimately CEO. Mr. Rady began his career with Amoco where he served 10 years as a geologist focused on the Rockies and Mid‑Continent. Mr. Rady holds a B.A. in Geology from Western State College of Colorado and M.Sc. in Geology from Western Washington University.
Mr. Rady’s significant experience as a chief executive of oil and gas companies, together with his training as a geologist and broad industry knowledge, enable Mr. Rady to provide the board with executive counsel on a full range of business, strategic and professional matters.
Glen C. Warren, Jr. has served as President, Chief Financial Officer and Secretary and as a director since May 2004. Mr. Warren also served as President and Chief Financial Officer and as a director of our predecessor company, Antero Resources Corporation, from its founding in 2002 to its ultimate sale to XTO Energy, Inc. in April 2005. Mr. Warren also serves on the Board of Directors of the general partner of Antero Midstream Partners LP. Prior to Antero Resources Corporation, Mr. Warren served as EVP, CFO and Director of Pennaco Energy from 1998 until its sale to Marathon in early 2001. Mr. Warren spent 10 years as a natural resources investment banker focused on equity and debt financing and M&A advisory with Lehman Brothers, Dillons Read & Co. Inc. and Kidder, Peabody & Co. Mr. Warren began his career as a landman in the Gulf Coast region with Amoco, where he spent six years. Mr. Warren holds a B.A. from the University of Mississippi, a J.D. from the University of Mississippi School of Law and an M.B.A. from the Anderson School of Management at U.C.L.A.
Mr. Warren’s significant experience as a chief financial officer of oil and gas companies, together with his experience as an investment banker and broad industry knowledge, enable Mr. Warren to provide the board with executive counsel on a full range of business, strategic, financial and professional matters.
Michael N. Kennedy has served as Senior Vice President of Finance since January 2016, prior to which he served as Vice President of Finance beginning in August 2013. Mr. Kennedy was Executive Vice President and Chief Financial Officer of Forest Oil Corporation (“Forest”) from 2009 to 2013. From 2001 until 2009, Mr. Kennedy held various financial positions of increasing responsibility within Forest. From 1996 to 2001, Mr. Kennedy was an auditor with Arthur Andersen LLP focusing on the Natural Resources industry. Mr. Kennedy holds a B.S. in Accounting from the University of Colorado at Boulder.
Kevin J. Kilstrom has served as Senior Vice President since January 2016, prior to which he served as Vice President of Production beginning in June 2007. Mr. Kilstrom was a Manager of Petroleum Engineering with AGL Energy of Sydney, Australia from 2006 to 2007. Prior to AGL, Mr. Kilstrom was with Marathon Oil as an Engineering Consultant and Asset Manager from 2003 to 2006 and as a Business Unit Manager for Marathon’s Powder River coal bed methane assets from 2001 to 2003. Mr. Kilstrom also served as a member of the board of directors of three Marathon subsidiaries from October 2003 through May 2005. Mr. Kilstrom was an Operations Manager and reserve engineer at Pennaco Energy from 1999 to 2001. Mr. Kilstrom was at Amoco for more than 22 years prior to 1999. Mr. Kilstrom holds a B.S. in Engineering from Iowa State University and an M.B.A. from DePaul University.
Ward D. McNeilly serves as Senior Vice President of Reserves, Planning & Midstream, and has been with the Company since October 2010. Mr. McNeilly has 35 years of experience in oil and gas asset management, operations, and reservoir management. From 2007 to October 2010, Mr. McNeilly was BHP Billiton’s Gulf of Mexico Operations Manager. From 1996 through 2007, Mr. McNeilly served in various North Sea and Gulf of Mexico Deepwater operations and asset management positions with Amoco and then BP. Mr. McNeilly served in a number of different domestic and international positions with Amoco from 1979 to 1996. Mr. McNeilly holds a B.S. in Geological Engineering from the Mackay School of Mines at the University of Nevada.
Alvyn A. Schopp has served as Chief Administrative Officer, Regional Senior Vice President, and Treasurer since January 2016. Mr. Schopp also served as Chief Administrative Officer, Regional Vice President, and Treasurer from September 2013 to January 2016, as Vice President of Accounting and Administration and Treasurer from January 2005 to September 2013, as Controller and Treasurer from 2003 to 2005 and as Vice President of Accounting and Administration and Treasurer of our predecessor company, Antero Resources Corporation, from January 2005 until its ultimate sale to XTO Energy, Inc. in April 2005. From 2002 to 2003, Mr. Schopp was an Executive Financial Consultant with Duke Energy Field Services. From 1993 to 2000, Mr. Schopp was CFO, Director and ultimately CEO of T‑Netix. From 1980 to 1993 Mr. Schopp was with KPMG LLP, most recently as a Senior Manager focusing on the energy and mining industries. Mr. Schopp holds a B.B.A. from Drake University.
Robert J. Clark has served as a director, member of the audit committee and Chairman of the compensation committee since our initial public offering in October 2013. Mr. Clark has been Chairman and Chief Executive Officer of 3 Bear Energy, LLC, a midstream energy company with operations in the Rocky Mountains, since its formation in March 2013. Prior to the formation of 3 Bear Energy LLC, Mr. Clark formed, operated and subsequently sold Bear Tracker Energy in February 2013 (to Summit Midstream Partners, LP), a portion of Bear Cub Energy in April 2007 (to Regency Energy Partners, L.P.) and the remaining portion in December 2008 (to GeoPetro Resources Company) and Bear Paw Energy in 2001 (to ONEOK Partners, L.P., formerly Northern Border Partners, L.P.). Mr. Clark was President of SOCO Gas Systems, Inc. and Vice President‑ Gas Management for Snyder Oil Corporation from 1988 to 1995. Mr. Clark served as Vice President Gas‑Gathering, Processing and Marketing of Ladd Petroleum Corporation, an affiliate of General Electric, from 1985 to 1988. Prior to 1985, Mr. Clark held various management positions with NICOR, Inc. Mr. Clark received his Bachelor of Science degree from Bradley University and his Master’s Degree in Business Administration from Northern Illinois University. Mr. Clark is a member of the board of trustees of Bradley University and serves on the board of trustees of Children’s Hospital Colorado Foundation.
Mr. Clark has significant experience with energy companies, with over 46 years of experience in the industry. We believe his background and skill set make Mr. Clark well‑suited to serve as a member of our board of directors.
Richard W. Connor has served as a director and chairman of our audit committee since September 1, 2013. Prior to his retirement in September 2009, Mr. Connor was an audit partner with KPMG LLP, or KPMG, where he principally served publicly traded clients in the energy, mining, telecommunications, and media industries for 38 years. Mr. Connor was elected to the partnership in 1980 and was appointed to KPMG’s SEC Reviewing Partners Committee in 1987 where he served until his retirement. From 1996 to September 2008, he served as the Managing Partner of KPMG’s Denver office. Mr. Connor earned his B.S. degree in accounting from the University of Colorado. Mr. Connor is a member of the Board of Directors of Zayo Group LLC, a provider of bandwidth
infrastructure and colocation services. Mr. Connor is also a director of Centerra Gold, Inc. (TSX: CG.T), a Toronto‑based gold mining company listed on the Toronto Stock Exchange. Mr. Connor also serves as a director and chairman of the audit committee of the general partner of Antero Midstream Partners LP.
Mr. Connor has experience in technical accounting and auditing matters, knowledge of SEC filing requirements and experience with a variety of energy clients. We believe his background and skill set make Mr. Connor well‑suited to serve as a member of our board of directors and as chairman of our audit committee.
Benjamin A. Hardesty has served as a director, chairman of our nominating and governance committees, and member of our compensation committee since our initial public offering in October 2013. He has also served as a member of our audit committee since September 2014. Mr. Hardesty has been the owner of Alta Energy LLC, a consulting business focused on oil and natural gas in the Appalachian Basin and onshore United States, since May 2010. In May 2010, Mr. Hardesty retired as president of Dominion E&P, Inc., a subsidiary of Dominion Resources Inc. (NYSE: D) engaged in the exploration and production of natural gas in North America, a position he had held since September 2007. Mr. Hardesty joined Dominion in 1995 and served as president of Dominion Appalachian Development, Inc. until 2000 and general manager and vice president—Northeast Gas Basins until 2007. Mr. Hardesty is a member of the board of directors of KLX, Inc. (NASDAQ: KLXI). From 1978 to 1995, Mr. Hardesty held operating and executive positions with Development Drilling Corp. and Stonewall Gas Company. Mr. Hardesty received his Bachelor of Science degree from West Virginia University and Master of Science degree from The George Washington University. Mr. Hardesty served as an activity duty officer in the United States Army Security Agency. Mr. Hardesty is a director emeritus and past president of the West Virginia Oil & Natural Gas Association and past president of the Independent Oil & Gas Association of West Virginia. Mr. Hardesty is a trustee and past chairman of The Nature Conservancy of West Virginia and a member of the board of directors of the West Virginia Chamber of Commerce. Mr. Hardesty serves as a member of the Visiting Committee of the Petroleum and Natural Gas Engineering Department of the Statler College of Engineering and Mineral Resources at West Virginia University.
Mr. Hardesty has significant experience in the oil and natural gas industry, including in our areas of operation. We believe his background and skill set make Mr. Hardesty well-suited to serve as a member of our board of directors.
Peter R. Kagan has served as a director since 2004. Mr. Kagan has been with Warburg Pincus since 1997 where he leads the firm’s investment activities in energy and natural resources. He is a Partner of Warburg Pincus & Co. and a Managing Director of Warburg Pincus LLC. He is also a member of Warburg Pincus LLC’s Executive Management Group. Mr. Kagan received a B.A. degree cum laude from Harvard College and J.D. and M.B.A. degrees with honors from the University of Chicago. Prior to joining Warburg Pincus, he worked in investment banking at Salomon Brothers in both New York and Hong Kong. Mr. Kagan currently also serves on the boards of directors of the following public companies: Laredo Petroleum, MEG Energy Corp. and Targa Resources Corp., as well as the boards of several private companies. Mr. Kagan also serves on the Board of Directors of the general partner of Antero Midstream Partners LP. In addition, he is a director of Resources for the Future and a trustee of Milton Academy.
Mr. Kagan has significant experience with energy companies and investments and broad knowledge of the oil and gas industry. We believe his background and skill set make Mr. Kagan well‑suited to serve as a member of our board of directors.
W. Howard Keenan, Jr. has served as a director since 2004. Mr. Keenan has over thirty-five years of experience in the financial and energy businesses. Since 1997, he has been a Member of Yorktown Partners LLC, a private investment manager focused on the energy industry. Mr. Keenan also serves on the Board of Directors of the general partner of Antero Midstream Partners LP. From 1975 to 1997, he was in the Corporate Finance Department of Dillon, Read & Co. Inc. and active in the private equity and energy areas, including the founding of the first Yorktown Partners fund in 1991. He is serving or has served as a director of multiple Yorktown Partners portfolio companies. Mr. Keenan holds an B.A. degree cum laude from Harvard College and an M.B.A. degree from Harvard University.
Mr. Keenan has significant experience with energy companies and investments and broad knowledge of the oil and gas industry. We believe his background and skill set make Mr. Keenan well‑suited to serve as a member of our board of directors.
James R. Levy has served as a director and member of our compensation committee since our initial public offering in October 2013. Mr. Levy joined Warburg Pincus in 2006 and focuses on investments in the energy industry. Mr. Levy is a Partner of Warburg Pincus & Co. and a Managing Director of Warburg Pincus LLC. Prior to joining Warburg Pincus, Mr. Levy worked as a private equity investor at Kohlberg & Company and in M&A advisory at Wasserstein Perella & Co. Mr. Levy currently serves on the board of directors of Laredo Petroleum and several private companies. He is a former director of Broad Oak Energy. Mr. Levy received a Bachelor of Arts degree from Yale University.
Mr. Levy has significant experience with energy companies and investments and broad knowledge of the oil and gas industry. We believe his background and skill set make Mr. Levy well‑suited to serve as a member of our board of directors.
Christopher R. Manning has served as a director since 2005. Mr. Manning has been a Partner with Trilantic Capital Partners since its formation and spin out from Lehman Brothers Merchant Banking in April 2009, and is currently a member of its Executive Committee and Chairman of Trilantic Energy Partners. His primary focus is on investments in the energy sector. Mr. Manning joined Lehman Brothers Merchant Banking in 2000 and was concurrently the Head of Lehman Brothers’ Investment Management Division, including both the Asset Management and Private Equity businesses, in Asia‑Pacific from 2006 to 2008. He was also a member of the Global Investment Management Division Executive Committee and the Private Equity Division Operating Committee. Prior to Lehman Brothers, Mr. Manning was the chief financial officer of The Wing Group, a developer of international power projects. Prior to The Wing Group, he was in the investment banking department of Kidder, Peabody & Co., where he worked on M&A and corporate finance transactions in the energy sector. Mr. Manning currently serves on the boards of Enduring Resources, LLC, Fluid Delivery Solutions, Templar Energy LLC, Trail Ridge Energy Partners II LLC, TRP Energy LLC, Velvet Energy, Ltd., and Ward Energy Partners. Mr. Manning also serves on the Board of Directors of the general partner of Antero Midstream Partners LP. Mr. Manning was previously Chairman of the Board of LB Pacific and TLP Energy and a director of Mediterranean Resources and VantaCore Partners. Mr. Manning holds an M.B.A. from The Wharton School of the University of Pennsylvania and a B.B.A. from the University of Texas at Austin.
Mr. Manning has significant experience with energy companies and investments and broad knowledge of the oil and gas industry. We believe his background and skill set make Mr. Manning well‑suited to serve as a member of our board of directors.
Item 11. Executive Compensation
Pursuant to General Instruction G(3) to Form 10‑K, we incorporate by reference into this Item the information to be disclosed in our definitive proxy statement for our 2016 Annual Meeting of Stockholders.
Item 12. Security Ownership of Certain Beneficial Owners and Management
Pursuant to General Instruction G(3) to Form 10‑K, we incorporate by reference into this Item the information to be disclosed in our definitive proxy statement for our 2016 Annual Meeting of Stockholders.
Item 13. Certain Relationships and Related Transactions and Director Independence
Pursuant to General Instruction G(3) to Form 10‑K, we incorporate by reference into this Item the information to be disclosed in our definitive proxy statement for our 2016 Annual Meeting of Stockholders.
Item 14. Principal Accountant Fees and Services
Pursuant to General Instruction G(3) to Form 10‑K, we incorporate by reference into this Item the information to be disclosed in our definitive proxy statement for our 2016 Annual Meeting of Stockholders.
PART IV
Item 15. Exhibits and Financial Statement Schedules
(a)(1) and (a)(2) Financial Statements and Financial Statement Schedules
The consolidated financial statements are listed on the Index to Financial Statements to this report beginning on page F‑1.
(a)(3) Exhibits.
|
|
|
|
|
|
Exhibit
Number
|
|
Description of Exhibit
|
|
| 2.1
|
|
Contribution, Conveyance and Assumption Agreement, dated as of September 17, 2015, by and among Antero Resources Corporation, Antero Midstream Partners LP and Antero Treatment LLC (incorporated by reference to Exhibit 2.1 to Current Report on Form 8-K (Commission File No. 001-36120) filed on September 18, 2015).
|
|
| 2.2
|
|
Purchase and Sale Agreement, dated June 1, 2012, between Antero Resources Corporation and Vanguard Permian, LLC (incorporated by reference to Exhibit 2.1 to Current Report on Form 8-K (Commission File No. 333-164876) filed on July 5, 2012)
|
|
| 2.3
|
|
Purchase and Sale Agreement by and among Antero Resources Piceance LLC, Antero Resources Pipeline LLC and Ursa Resources Group II LLC, dated as of November 1, 2012 (incorporated by reference to Exhibit 2.1 to Current Report on Form 8-K (Commission File No. 333-164876) filed on November 6, 2012).
|
|
| 3.1
|
|
Amended and Restated Certificate of Incorporation of Antero Resources Corporation (incorporated by reference to Exhibit 3.1 to Current Report on Form 8-K (Commission File No. 001-36120) filed on October 17, 2013).
|
|
| 3.2
|
|
Amended and Restated Bylaws of Antero Resources Corporation (incorporated by reference to Exhibit 3.2 to Current Report on Form 8-K (Commission File No. 001-36120) filed on October 17, 2013).
|
|
| 4.1
|
|
Indenture related to the 6.0% Senior Notes due 2020, dated as of November 19, 2012, by and among Antero Resources Finance Corporation, the several guarantors named therein and Wells Fargo Bank, National Association, as trustee (incorporated by reference to Exhibit 4.1 to Current Report on Form 8-K (Commission File No. 333-164876) filed on November 20, 2012).
|
|
| 4.2
|
|
Form of 6.0% Senior Note due 2020 (incorporated by reference to Exhibit 4.2 to Current Report on Form 8- K (Commission File No. 333-164876) filed on November 20, 2012).
|
|
| 4.3
|
|
First Supplemental Indenture related to the 6.0% Senior Notes due 2020, dated October 16, 2013, by and among Antero Resources Finance Corporation, the several guarantors named therein and Wells Fargo Bank, National Association, as trustee (incorporated by reference to Exhibit 4.10 to Annual Report on Form 10-K (Commission File No. 001-36120) filed on February 27, 2014).
|
|
| 4.4
|
|
Second Supplemental Indenture related to the 6.0% Senior Notes due 2020, dated October 21, 2013, by and among Antero Resources Finance Corporation, the several guarantors named therein and Wells Fargo Bank, National Association, as trustee (incorporated by reference to Exhibit 4.11 to Annual Report on Form 10-K (Commission File No. 001-36120) filed on February 27, 2014).
|
|
| 4.5
|
|
Third Supplemental Indenture related to the 6.0% Senior Notes due 2020, dated December 31, 2013, by and among Antero Resources Finance Corporation, the several guarantors named therein and Wells Fargo Bank, National Association, as trustee (incorporated by reference to Exhibit 4.12 to Annual Report on Form 10-K (Commission File No. 001-36120) filed on February 27, 2014).
|
|
| 4.6
|
|
Fourth Supplemental Indenture related to the 6.0% Senior Notes due 2020, dated March 18, 2014, by and among Antero Resources Corporation, the several guarantors named therein and Wells Fargo Bank, National Association, as trustee (incorporated by reference to Exhibit 4.2 to Quarterly Report on Form 10-Q (Commission File No. 001-36120) filed on May 7, 2014).
|
|
| 4.7
|
|
Registration Rights Agreement related to the 6.0% Senior Notes due 2020, dated as of November 19, 2012, by and among Antero Resources LLC and the other parties named therein and Wells Fargo Securities as representative for the initial purchasers named therein (incorporated by reference to Exhibit 4.3 to Current Report on Form 8-K (Commission File No. 333-164876) filed on November 20, 2012).
|
|
| 4.8
|
|
Registration Rights Agreement related to the 6.0% Senior Notes due 2020, dated as of February 4, 2013, by and among Antero Resources Finance Corporation, the several guarantors named therein and J.P. Morgan Securities LLC as representative of the initial purchasers named therein (incorporated by reference to Exhibit 4.3 to Current Report on Form 8-K (Commission File No. 333-164876) filed on February 4, 2013).
|
|
| 4.9
|
|
Indenture related to the 5.375% Senior Notes due 2021, dated as of November 5, 2013, by and among Antero Resources Finance Corporation, the several guarantors named therein and Wells Fargo Bank, National Association, as trustee (incorporated by reference to Exhibit 4.1 to Current Report on Form 8-K (Commission File No. 001-36120) filed on November 7, 2013).
|
|
| 4.10
|
|
Form of 5.375% Senior Note due 2021 (incorporated by reference to Exhibit 4.2 to Current Report on Form 8-K (Commission File No. 001-36120) filed on November 7, 2013).
|
|
| 4.11
|
|
First Supplemental Indenture related to the 5.375% Senior Notes due 2021, dated as of December 31, 2013, by and among Antero Resources Finance Corporation, the several guarantors named therein and Wells Fargo Bank, National Association, as trustee (incorporated by reference to Exhibit 4.17 to Annual Report on Form 10-K (Commission File No. 001-36120) filed on February 27, 2014).
|
|
| 4.12
|
|
Second Supplemental Indenture related to the 5.375% Senior Notes due 2021, dated as of March 18, 2014, by and among Antero Resources Corporation, the several guarantors named therein and Wells Fargo Bank, National Association, as trustee (incorporated by reference to Exhibit 4.3 to Quarterly Report on Form 10-Q (Commission File No. 001-36120) filed on May 7, 2014).
|
|
| 4.13
|
|
Registration Rights Agreement related to the 5.375% Senior Notes due 2021, dated as of November 5, 2013, by and among Antero Resources Finance Corporation, the several guarantors named therein and J.P. Morgan Securities LLC as representative of the initial purchasers named therein (incorporated by reference to Exhibit 4.3 to Current Report on Form 8-K (Commission File No. 001-36120) filed on November 7, 2013).
|
|
| 4.14
|
|
Registration Rights Agreement, dated as of October 16, 2013, by and among Antero Resources Corporation and the owners of the membership interests in Antero Resources Investment LLC (incorporated by reference to Exhibit 10.1 to Current Report on Form 8-K (Commission File No. 001-36120) filed on October 17, 2013).
|
|
| 4.15
|
|
Indenture related to the 5.125% Senior Notes due 2022, dated as of May 6, 2014, by and among Antero Resources Corporation, the several guarantors named therein and Wells Fargo Bank, National Association, as trustee (incorporated by reference to Exhibit 4.1 to Current Report on Form 8-K (Commission File No. 001-36120) filed on May 8, 2014).
|
|
| 4.16
|
|
Form of 5.125% Senior Note due 2022 (incorporated by reference to Exhibit 4.2 to Current Report on Form 8-K (Commission File No. 001-36120) filed on May 8, 2014).
|
|
| 4.17
|
|
First Supplemental Indenture related to the 5.125% Senior Notes due 2022, dated as of November 24, 2014, by and among Antero Resources Corporation, the several guarantors named therein and Wells Fargo Bank, National Association, as trustee (incorporated by reference to Exhibit 4.3 to Antero Resource Corporation’s Registration Statement on Form S-4 (Commission File No. 333-200605) filed on November 26, 2014).
|
|
| 4.18
|
|
Second Supplemental Indenture related to the 5.125% Senior Notes due 2022, dated as of January 21, 2015, by and among Antero Resources Corporation, the several guarantors named therein and Wells Fargo Bank, National Association, as trustee (incorporated by reference to Exhibit 4.6 to Registration Statement Report on Form S-4 (Commission File No. 333-200605) filed on January 22, 2015).
|
|
| 4.19
|
|
Registration Rights Agreement related to the 5.125% Senior Notes due 2022, dated as of May 6, 2014, by and among Antero Resources Corporation and the other parties named therein and J.P. Morgan Securities LLC as representative for the initial purchasers named therein (incorporated by reference to Exhibit 4.3 to Current Report on Form 8-K (Commission File No. 001-36120) filed on May 8, 2014).
|
|
| 4.20
|
|
Registration Rights Agreement related to the 5.125% Senior Notes due 2022, dated as of September 18, 2014, by and among Antero Resources Corporation and the other parties named therein and J.P. Morgan Securities LLC as representative for the initial purchasers named therein (incorporated by reference to Exhibit 4.3 to Current Report on Form 8-K (Commission File No. 001-36120) filed on September 24, 2014).
|
|
| 4.21
|
|
Indenture related to the 5.625% Senior Notes due 2023, dated as of March 17, 2015, by and among Antero Resources Corporation, the several guarantors named therein and Wells Fargo Bank, National Association, as trustee (incorporated by reference to Exhibit 4.1 to Current Report on Form 8-K (Commission File No. 001-36120) filed on March 18, 2015).
|
|
| 4.22
|
|
Form of 5.625% Senior Note due 2023 (incorporated by reference to Exhibit 4.2 to Current Report on Form 8-K (Commission File No. 333-164876) filed on March 18, 2015).
|
|
| 4.23
|
|
Registration Rights Agreement, dated as of March 17, 2015, by and among Antero Resources Corporation, the subsidiary guarantors named therein and J.P. Morgan Securities LLC as representative of the initial purchasers named therein (incorporated by reference to Exhibit 4.3 to Current Report on Form 8-K (Commission File No. 001-36120) filed on March 18, 2015).
|
|
| 10.1
|
|
Contribution Agreement, dated as of October 16, 2013, by and between Antero Resources Corporation and Antero Resources Midstream LLC (incorporated by reference to Exhibit 10.2 to Current Report on Form 8-K (Commission File No. 001-36120) filed on October 17, 2013).
|
|
| 10.2
|
|
Secondment Agreement, dated as of September 23, 2015, by and between Antero Midstream Partners LP, Antero Resources Midstream Management LLC, Antero Midstream LLC, Antero Water LLC, Antero Treatment LLC and Antero Resources Corporation (incorporated by reference to Exhibit 10.1 to Current Report on Form 8-K (Commission File No. 001-36120) filed on September 24, 2015).
|
|
| 10.3
|
|
Amended and Restated Services Agreement, dated as of September 23, 2015, by and among Antero Midstream Partners LP, Antero Resources Midstream Management LLC and Antero Resources Corporation (incorporated by reference to Exhibit 10.2 to Current Report on Form 8-K (Commission File No. 001-36120) filed on September 24, 2015).
|
|
|
10.4†
|
|
Water Services Agreement, dated as of September 23, 2015, by and between Antero Resources Corporation andAntero Water LLC (incorporated by reference to Exhibit 10.3 to Quarterly Report on Form 10-Q (Commission File No. 001-36120) filed on October 28, 2015).
|
|
| 10.5
|
|
Form of Indemnification Agreement (incorporated by reference to Exhibit 10.15 to Amendment No. 3 to Antero Resources Corporation’s Registration Statement on Form S-1/A (Commission File No. 333-189284), filed on September 24, 2013).
|
|
| 10.6
|
|
Agreement and Plan of Merger, dated as of October 1, 2013, by and among Antero Resources Corporation, Antero Resources LLC and Antero Resources Investment LLC (incorporated by reference to Exhibit 10.1 to Current Report on Form 8-K (Commission File No. 333-164876) filed on October 11, 2013).
|
|
| 10.7
|
|
Antero Resources Corporation Long-Term Incentive Plan, effective as of October 1, 2013 (incorporated by reference to Exhibit 4.3 to the Company’s Registration Statement on Form S-8 (Commission File No. 001- 36120) filed on October 11, 2013).
|
|
| 10.8
|
|
Limited Liability Company Agreement of Antero Resources Midstream LLC (incorporated by reference to Exhibit 10.4 to Current Report on Form 8-K (Commission File No. 001-36120) filed on October 17, 2013).
|
|
| 10.9
|
|
Fourth Amended And Restated Credit Agreement dated as of November 4, 2010 among Antero Resources Corporation, Antero Resources Piceance Corporation, Antero Resources Pipeline Corporation and Antero Resources Appalachian Corporation, as Borrowers, certain subsidiaries of Borrowers, as Guarantors, the Lenders party thereto, JPMorgan Chase Bank, N.A., as Administrative Agent, Wells Fargo Bank, N.A., as Syndication Agent, Bank of Scotland Plc, Union Bank, N.A., Credit Agricole Corporate and Investment Bank, BNP Paribas and Deutsche Bank Trust Company Americas, as Co-Documentation Agents and J.P. Morgan Securities LLC and Wells Fargo Securities, LLC, as Joint Lead Arrangers and Joint Bookrunners (incorporated by reference to Exhibit 10.1 to Current Report on Form 8-K (Commission File No. 333-164876) filed on November 8, 2010).
|
|
| 10.10
|
|
First Amendment to the Fourth Amended And Restated Credit Agreement, dated as of May 12, 2011, among Antero Resources Corporation, Antero Resources Piceance Corporation, Antero Resources Pipeline Corporation and Antero Resources Appalachian Corporation, as Borrowers, certain subsidiaries of Borrowers, as Guarantors, the Lenders party thereto and JPMorgan Chase Bank, N.A., as Administrative Agent (incorporated by reference to Exhibit 10.1 to Quarterly Report on Form 10-Q (Commission File No. 333-164876) filed on May 16, 2011).
|
|
| 10.11
|
|
Second Amendment to Fourth Amended And Restated Credit Agreement dated as of July 8, 2011 among Antero Resources Corporation, Antero Resources Piceance Corporation, Antero Resources Pipeline Corporation and Antero Resources Appalachian Corporation, as Borrowers, certain subsidiaries of Borrowers, as Guarantors, the Lenders party thereto and JP Morgan Chase Bank, N.A., as Administrative Agent (incorporated by reference to Exhibit 10.1 to Current Report on Form 8-K (Commission File No. 333-164876) filed on July 11, 2011).
|
|
| 10.12
|
|
Third Amendment to Fourth Amended And Restated Credit Agreement dated as of October 26, 2011 among Antero Resources Corporation, Antero Resources Piceance Corporation, Antero Resources Pipeline Corporation and Antero Resources Appalachian Corporation, as Borrowers, certain subsidiaries of Borrowers, as Guarantors, the Lenders party thereto and JP Morgan Chase Bank, N.A., as Administrative Agent (incorporated by reference to Exhibit 10.1 to Current Report on Form 8-K (Commission File No. 333-164876) filed on October 28, 2011).
|
|
| 10.13
|
|
Fourth Amendment to Fourth Amended And Restated Credit Agreement dated as of May 4, 2012 among Antero Resources Corporation, Antero Resources Piceance Corporation, Antero Resources Pipeline Corporation and Antero Resources Appalachian Corporation, as Borrowers, certain subsidiaries of Borrowers, as Guarantors, the Lenders party thereto and JP Morgan Chase Bank, N.A., as Administrative Agent (incorporated by reference to Exhibit 10.1 to Current Report on Form 8-K (Commission File No. 333-164876) filed on May 7, 2012).
|
|
| 10.14
|
|
Fifth Amendment to Fourth Amended and Restated Credit Agreement dated as of October 25, 2012 among Antero Resources Arkoma LLC, Antero Resources Piceance LLC, Antero Resources Pipeline LLC and Antero Resources Appalachian Corporation, as Borrowers, certain subsidiaries of Borrowers, as Guarantors, the Lenders party hereto, and JP Morgan Chase Bank, N.A. as Administrative Agent (incorporated by reference to Exhibit 10.1 to Current Report on Form 8-K (Commission File No. 333-164876) filed on October 26, 2012).
|
|
| 10.15
|
|
Sixth Amendment to Fourth Amended and Restated Credit Agreement dated as of May 9, 2013 by and among Antero Resources Appalachian Corporation and JPMorgan Chase Bank, N.A., as administrative agent for the lenders, to increase the borrowing base and lender commitments and amend the current ratio covenant under the Fourth Amended and Restated Credit Agreement dated as of November 4, 2010 (incorporated by reference to Exhibit 10.2 to Quarterly Report on Form 10-Q (Commission File No. 333-164876) filed on May 13, 2013).
|
|
| 10.16
|
|
Seventh Amendment to Fourth Amended and Restated Credit Agreement dated as of June 27, 2013 by and among Antero Resources Corporation and JPMorgan Chase Bank, N.A., as administrative agent for the lenders, to increase the borrowing base and lender commitments and amend the current ratio covenant under the Fourth Amended and Restated Credit Agreement dated as of November 4, 2010 (incorporated by reference to Exhibit 10.1 to Quarterly Report on Form 10-Q (Commission File No. 333-164876) filed on August 9, 2013).
|
|
| 10.17
|
|
Eighth Amendment to Fourth Amended and Restated Credit Agreement dated as of August 29, 2013 by and among Antero Resources Corporation and JPMorgan Chase Bank, N.A., as Administrative Agent (incorporated by reference to Exhibit 10.23 to Registration Statement on Form S-1/A (Commission File No. 333-189284) filed on August 30, 2013).
|
|
| 10.18
|
|
Ninth Amendment to Fourth Amended and Restated Credit Agreement, dated as of October 21, 2013, among Antero Resources Corporation, as Borrower, certain subsidiaries of the Borrower, as Guarantors, the Lenders party thereto and JP Morgan Chase Bank, N.A., as Administrative Agent (incorporated by reference to Exhibit 10.1 to Current Report on Form 8-K (Commission File No. 001-36120) filed on October 22, 2013).
|
|
| 10.19
|
|
Tenth Amendment to Fourth Amended and Restated Credit Agreement, dated as of February 28, 2014, among Antero Resources Corporation, as Borrower, certain subsidiaries of the Borrower, as Guarantors, the Lenders party thereto and JP Morgan Chase Bank, N.A., as Administrative Agent (incorporated by reference to Exhibit 10.1 to Quarterly Report on Form 10-Q (Commission File No. 001-36120) filed on May 7, 2014).
|
|
| 10.20
|
|
Eleventh Amendment to Fourth Amended and Restated Credit Agreement, dated as of February 28, 2014, among Antero Resources Corporation, as Borrower, certain subsidiaries of the Borrower, as Guarantors, the Lenders party thereto and JP Morgan Chase Bank, N.A., as Administrative Agent (incorporated by reference to Exhibit 10.1 to Current Report on Form 8-K (Commission File No. 001-36120) filed on May 8, 2014).
|
|
| 10.21
|
|
Twelfth Amendment to Fourth Amended and Restated Credit Agreement, dated as of July 28, 2014, among Antero Resources Corporation, as Borrower, certain subsidiaries of the Borrower, as Guarantors, the Lenders party thereto and JP Morgan Chase Bank, N.A., as Administrative Agent (incorporated by reference to Exhibit 10.1 to Current Report on Form 8-K (Commission File No. 001-36120) filed on July 31, 2014).
|
|
| 10.22
|
|
Thirteenth Amendment to Fourth Amended and Restated Credit Agreement, dated as September 8, 2014, among Antero Resources Corporation, as Borrower, certain subsidiaries of the Borrower, as Guarantors, the Lenders party thereto and JP Morgan Chase Bank, N.A., as Administrative Agent (incorporated by reference to Exhibit 10.1 to Current Report on Form 8-K (Commission File No. 001-36120) filed on September 10, 2014).
|
|
| 10.23
|
|
Fourteenth Amendment to Fourth Amended and Restated Credit Agreement, dated as October 16, 2014, among Antero Resources Corporation, as Borrower, certain subsidiaries of the Borrower, as Guarantors, the Lenders party thereto and JP Morgan Chase Bank, N.A., as Administrative Agent (incorporated by reference to Exhibit 10.1 to Current Report on Form 8-K (Commission File No. 001-36120) filed on October 22, 2014).
|
|
| 10.24
|
|
Fifteenth Amendment to Fourth Amended and Restated Credit Agreement, dated as November 10, 2014, among Antero Resources Corporation, as Borrower, certain subsidiaries of the Borrower, as Guarantors, the Lenders party thereto and JP Morgan Chase Bank, N.A., as Administrative Agent (incorporated by reference to Exhibit 10.1 to Current Report on Form 8-K (Commission File No. 001-36120) filed on November 17, 2014).
|
|
| 10.25
|
|
Sixteenth Amendment to Fourth Amended and Restated Credit Agreement, dated as of February 17, 2015, by and among Antero Resources Corporation, as Borrower, certain subsidiaries of the Borrower, as Guarantors, the Lenders party thereto, and JP Morgan Chase Bank, N.A., as Administrative Agent (incorporated by reference to Exhibit 10.1 to Current Report on Form 8-K (Commission File No. 001-36120) filed on February 17, 2015).
|
|
| 10.26
|
|
Seventeenth Amendment to Fourth Amended and Restated Credit Agreement, dated as of October 26, 2015, by and among Antero Resources Corporation, certain subsidiaries of the Borrower, as Guarantors, the Lenders party thereto, and JPMorgan Chase Bank, N.A., as Administrative Agent (incorporated by reference to Exhibit 10.4 to Quarterly Report on Form 10-Q (Commission File No. 001-36120) filed on October 28, 2015).
|
|
| 10.27
|
|
Eighteenth Amendment to Fourth Amended and Restated Credit Agreement, dated as of January 12, 2016, by and among Antero Resources Corporation, certain subsidiaries of the Borrower, as Guarantors, the Lenders party thereto, and JPMorgan Chase Bank, N.A., as Administrative Agent (incorporated by reference to Exhibit 10.1 to Current Report on Form 8-K (Commission File No. 001-36120) filed on January 15, 2016).
|
|
| 10.28
|
|
Credit Agreement, dated as of February 28, 2014, among Antero Resources Midstream Operating LLC, as Borrower, certain subsidiaries of the Borrower, as Guarantors, the Lenders party thereto and JP Morgan Chase Bank, N.A., as Administrative Agent (incorporated by reference to Exhibit 10.2 to Quarterly Report on Form 10-Q (Commission File No. 001-36120) filed on May 7, 2014).
|
|
| 10.29
|
|
First Amendment to Credit Agreement, dated as of May 5, 2014, among Antero Resources Midstream Operating LLC, as Borrower, certain subsidiaries of the Borrower, as Guarantors, the Lenders party thereto and JP Morgan Chase Bank, N.A., as Administrative Agent (incorporated by reference to Exhibit 10.2 to Current Report on Form 8-K (Commission File No. 001-36120) filed on May 8, 2014).
|
|
| 10.30
|
|
Second Amendment to Credit Agreement, dated as of July 28, 2014, among Antero Resources Midstream Operating LLC, as Borrower, certain subsidiaries of the Borrower, as Guarantors, the Lenders party thereto and JP Morgan Chase Bank, N.A., as Administrative Agent (incorporated by reference to Exhibit 10.2 to Current Report on Form 8-K (Commission File No. 001-36120) filed on July 31, 2014).
|
|
| 10.31
|
|
Third Amendment to Credit Agreement, dated as of October 16, 2014, among Antero Resources Midstream Operating LLC, as Borrower, certain subsidiaries of the Borrower, as Guarantors, the Lenders party thereto and JP Morgan Chase Bank, N.A., as Administrative Agent (incorporated by reference to Exhibit 10.2 to Current Report on Form 8-K (Commission File No. 001-36120) filed on October 22, 2014).
|
|
| 10.32
|
|
Fourth Amendment to Credit Agreement, dated as of November 10, 2014, among Antero Resources Midstream Operating LLC, as Borrower, certain subsidiaries of the Borrower, as Guarantors, the Lenders party thereto and JP Morgan Chase Bank, N.A., as Administrative Agent (incorporated by reference to Exhibit 10.7 to Current Report on Form 8-K (Commission File No. 001-36120) filed on November 17, 2014).
|
|
| 10.33
|
|
Fifth Amendment to Credit Agreement, dated as of November 7, 2014, among Antero Resources Midstream Operating LLC, as Borrower, certain subsidiaries of the Borrower, as Guarantors, the Lenders party thereto and JP Morgan Chase Bank, N.A., as Administrative Agent (incorporated by reference to Exhibit 10.6 to Current Report on Form 8-K (Commission File No. 001-36120) filed on November 17, 2014).
|
|
| 10.34
|
|
Sixth Amendment to Credit Agreement, dated as of February 17, 2015, by and among Antero Water LLC, as Borrower, certain subsidiaries of the Borrower, as Guarantors, the Lenders party thereto, and JP Morgan Chase Bank, N.A., as Administrative Agent (incorporated by reference to Exhibit 10.2 to Current Report on Form 8-K (Commission File No. 001-36120) filed on February 17, 2015).
|
|
| 10.35
|
|
Form of Restricted Stock Unit Grant Notice and Restricted Stock Unit Agreement under the Antero Resources Corporation Long-Term Incentive Plan (incorporated by reference to Exhibit 10.28 to Annual Report on Form 10-K (Commission File No. 001-36120) filed on February 25, 2015).
|
|
|
10.36*
|
|
Form of Bonus Stock Grant Notice and Bonus Stock Agreement (Form for Non-Employee Directors) under the Antero Resources Corporation Long-Term Incentive Plan.
|
|
| 10.37
|
|
Form of Performance Share Unit Grant Notice and Performance Share Unit Agreement (Form for Special Retention Awards) under the Antero Resources Corporation Long-Term Incentive Plan (incorporated by reference to Exhibit 10.1 to Current Report on Form 8-K (Commission File No. 001- 36120) filed on February 12, 2016).
|
|
| 10.38
|
|
Antero Midstream Partners LP Long-Term Incentive Plan (incorporated by reference to Exhibit 4.3 to Antero Midstream Partners’ Registration Statement on Form S-8 (Commission File No. 001- 36719) filed on November 12, 2014).
|
|
| 10.39
|
|
Form of Phantom Unit Grant Notice and Phantom Unit Agreement under the Antero Midstream Partners LP Long-Term Incentive Plan (incorporated by reference to Exhibit 4.4 to Antero Midstream Partners’ Registration Statement on Form S-8 (Commission File No. 001- 36719) filed on November 12, 2014).
|
|
| 10.40
|
|
Form of Restricted Unit Grant Notice and Restricted Unit Agreement under the Antero Midstream Partners LP Long-Term Incentive Plan (incorporated by reference to Exhibit 4.4 to Antero Midstream Partners’ Registration Statement on Form S-8 (Commission File No. 001- 36719) filed on November 12, 2014).
|
|
| 10.41
|
|
Form of Bonus Unit Grant Notice and Bonus Unit Agreement (Form for Non-Employee Directors) under the Antero Midstream Partners LP Long-Term Incentive Plan (incorporated by reference to Exhibit 10.12 to Antero Midstream Partners’ Annual Report on Form 10-K (Commission File No. 001- 36719) filed on February 24, 2016).
|
|
| 10.42
|
|
Letter Agreement dated June 29, 2012 by and among Antero Resources Corporation, Antero Resources Piceance Corporation, Antero Resources Pipeline Corporation, Antero Resources Appalachian Corporation and JPMorgan Chase Bank N.A., as administrative agent for the lenders, to reduce the borrowing base and lender commitments under the Fourth Amended and Restated Credit Agreement dated as of November 4, 2010 (incorporated by reference to Exhibit 10.1 to Current Report on Form 8-K (Commission File No. 333-164876) filed on July 5, 2012).
|
|
| 10.43
|
|
Letter Agreement dated November 19, 2012 by and among Antero Resources Arkoma LLC, Antero Resources Piceance LLC, Antero Resources Pipeline LLC, and Antero Resources Appalachian Corporation and JPMorgan Chase Bank N.A., as administrative agent for the lenders, to reduce the borrowing base and lender commitments under the Fourth Amended and Restated Credit Agreement dated as of November 4, 2010 (incorporated by reference to Exhibit 10.1 to Current Report on Form 8-K (Commission File No. 333-164876) filed on December 10, 2012).
|
|
| 10.44
|
|
Letter Agreement dated December 7, 2012 by and among Antero Resources Arkoma LLC, Antero Resources Piceance LLC, Antero Resources Pipeline LLC, and Antero Resources Appalachian Corporation and JPMorgan Chase Bank N.A., as administrative agent for the lenders, to reduce the borrowing base and lender commitments under the Fourth Amended and Restated Credit Agreement dated as of November 4, 2010 (incorporated by reference to Exhibit 10.2 to Current Report on Form 8-K (Commission File No. 333-164876) filed on December 10, 2012).
|
|
| 10.45
|
|
Letter Agreement dated February 4, 2013 by and among Antero Resources Arkoma LLC, Antero Resources Piceance LLC, Antero Resources Pipeline LLC, and Antero Resources Appalachian Corporation and JPMorgan Chase Bank, N.A., as administrative agent for the lenders, to reduce the borrowing base and lender commitments under the Fourth Amended and Restated Credit Agreement dated as of November 4, 2010 (incorporated by reference to Exhibit 10.2 to Current Report on Form 8-K (Commission File No. 333-164876) filed on February 4, 2013).
|
|
|
12.1*
|
|
Computation of Ratio of Earnings to Fixed Charges.
|
|
|
21.1*
|
|
Subsidiaries of Antero Resources Corporation.
|
|
|
23.1*
|
|
Consent of KPMG, LLP.
|
|
|
23.2*
|
|
Consent of DeGolyer and MacNaughton.
|
|
|
31.1*
|
|
Certification of the Company’s Chief Executive Officer Pursuant to Section 302 of the Sarbanes Oxley Act of 2002 (18 U.S.C. Section 7241).
|
|
|
31.2*
|
|
Certification of the Company’s Chief Financial Officer Pursuant to Section 302 of the Sarbanes Oxley Act of 2002 (18 U.S.C. Section 7241).
|
|
|
32.1*
|
|
Certification of the Company’s Chief Executive Officer Pursuant to Section 906 of the Sarbanes Oxley Act of 2002 (18 U.S.C. Section 1350).
|
|
|
32.2*
|
|
Certification of the Company’s Chief Financial Officer Pursuant to Section 906 of the Sarbanes Oxley Act of 2002 (18 U.S.C. Section 1350).
|
|
|
99.1*
|
|
Report of DeGolyer and MacNaughton, dated as of January 19, 2016, for proved reserves as of December 31, 2015.
|
|
| 99.2
|
|
Report of DeGolyer and MacNaughton, dated as of January 19, 2015, for proved reserves as of December 31, 2014 (incorporated by reference to Exhibit 99.1 to Annual Report on Form 10-K (Commission File No. 001- 36120) filed on February 25, 2015).
|
|
| 99.3
|
|
Report of DeGolyer and MacNaughton, dated as of January 15, 2014, for proved reserves as of December 31, 2013 (incorporated by reference to Exhibit 99.2 to Current Report on Form 8-K (Commission File No. 001- 36120) filed on February 7, 2013).
|
|
|
101*
|
|
The following financial information from this Form 10-K of Antero Resources Corporation for the year ended December 31, 2015, formatted in XBRL (eXtensible Business Reporting Language): (i) Consolidated Balance Sheets, (ii) Consolidated Statements of Operations and Comprehensive Income (Loss), (iii) Consolidated Statements of Equity, (iv) Consolidated Statements of Cash Flows, and (v) Notes to the Consolidated Financial Statements, tagged as blocks of text.
|
|
The exhibits marked with the asterisk symbol (*) are filed or furnished with this Annual Report on Form 10‑K.
†Portions of this exhibit have been omitted pursuant to a request for confidential treatment.
SIGNATURES
Pursuant to the requirements of Section 13 or 15(d) of the Securities Exchange Act of 1934, the registrant has duly caused this report to be signed on its behalf by the undersigned, thereunto duly authorized.
|
|
|
|
ANTERO RESOURCES CORPORATION
|
|
|
|
|
By:
|
/s/ GLEN C. WARREN, JR.
|
|
|
Glen C. Warren, Jr.
|
|
|
President, Chief Financial Officer and Secretary
|
|
|
|
|
Date:
|
February 24, 2016
|
Pursuant to the requirements of the Securities Exchange Act of 1934, this report has been signed by the following persons on behalf of the registrant in the capacities and on the dates indicated.
|
|
|
|
|
|
|
|
Signature
|
|
Title
|
|
Date
|
|
|
|
|
|
|
|
|
|
/s/ PAUL M. RADY
|
|
Chairman of the Board,
Director and Chief Executive officer
|
|
February 24, 2016
|
|
|
Paul M. Rady
|
|
(principal executive officer)
|
|
|
|
|
|
|
|
|
|
|
|
/s/ GLEN C. WARREN, JR.
|
|
President, Director,
Chief Financial Officer and Secretary
|
|
February 24, 2016
|
|
|
Glen C. Warren, Jr.
|
|
(principal financial officer)
|
|
|
|
|
|
|
|
|
|
|
|
/s/ K. PHIL YOO
|
|
Vice President—Accounting, Chief Accounting Officer and Corporate Controller
|
|
February 24, 2016
|
|
|
K. Phil Yoo
|
|
(principal accounting officer)
|
|
|
|
|
|
|
|
|
|
|
|
/s/ ROBERT J. CLARK
|
|
Director
|
|
February 24, 2016
|
|
|
Robert J. Clark
|
|
|
|
|
|
|
|
|
|
|
|
|
|
/s/ RICHARD W. CONNOR
|
|
Director
|
|
February 24, 2016
|
|
|
Richard W. Connor
|
|
|
|
|
|
|
|
|
|
|
|
|
|
/s/ BENJAMIN A. HARDESTY
|
|
Director
|
|
February 24, 2016
|
|
|
Benjamin A. Hardesty
|
|
|
|
|
|
|
|
|
|
|
|
|
|
/s/ PETER R. KAGAN
|
|
Director
|
|
February 24, 2016
|
|
|
Peter R. Kagan
|
|
|
|
|
|
|
|
|
|
|
|
|
|
/s/ W. HOWARD KEENAN, JR.
|
|
Director
|
|
February 24, 2016
|
|
|
W. Howard Keenan, Jr.
|
|
|
|
|
|
|
|
|
|
|
|
|
|
/s/ JAMES R. LEVY
|
|
Director
|
|
February 24, 2016
|
|
|
James R. Levy
|
|
|
|
|
|
|
|
|
|
|
|
|
|
/s/ CHRISTOPHER R. MANNING
|
|
Director
|
|
February 24, 2016
|
|
|
Christopher R. Manning
|
|
|
|
|
|
INDEX TO FINANCIAL STATEMENTS
REPORT OF INDEPENDENT REGISTERED PUBLIC ACCOUNTING FIRM
The Board of Directors and Stockholders
Antero Resources Corporation:
We have audited the accompanying consolidated balance sheets of Antero Resources Corporation and subsidiaries (the Company) as of December 31, 2014 and 2015, and the related consolidated statements of operations and comprehensive income (loss), equity, and cash flows for each of the years in the three‑year period ended December 31, 2015. These consolidated financial statements are the responsibility of the Company’s management. Our responsibility is to express an opinion on these consolidated financial statements based on our audits.
We conducted our audits in accordance with the standards of the Public Company Accounting Oversight Board (United States). Those standards require that we plan and perform the audit to obtain reasonable assurance about whether the financial statements are free of material misstatement. An audit includes examining, on a test basis, evidence supporting the amounts and disclosures in the financial statements. An audit also includes assessing the accounting principles used and significant estimates made by management, as well as evaluating the overall financial statement presentation. We believe that our audits provide a reasonable basis for our opinion.
In our opinion, the consolidated financial statements referred to above present fairly, in all material respects, the financial position of Antero Resources Corporation and subsidiaries as of December 31, 2014 and 2015, and the results of their operations and their cash flows for each of the years in the three‑year period ended December 31, 2015, in conformity with U.S. generally accepted accounting principles.
We also have audited, in accordance with the standards of the Public Company Accounting Oversight Board (United States), Antero Resources Corporation’s internal control over financial reporting as of December 31, 2015, based on criteria established in Internal Control – Integrated Framework (2013) issued by the Committee of Sponsoring Organizations of the Treadway Commission (COSO), and our report dated February 24, 2016 expressed an unqualified opinion on the effectiveness of the Company’s internal control over financial reporting.
/s/ KPMG LLP
Denver, Colorado
February 24, 2016
REPORT OF INDEPENDENT REGISTERED PUBLIC ACCOUNTING FIRM
The Board of Directors and Stockholders
Antero Resources Corporation:
We have audited Antero Resources Corporation’s internal control over financial reporting as of December 31, 2015, based on criteria established in Internal Control – Integrated Framework (2013) issued by the Committee of Sponsoring Organizations of the Treadway Commission (COSO). Antero Resources Corporation’s management is responsible for maintaining effective internal control over financial reporting and for its assessment of the effectiveness of internal control over financial reporting, included in the accompanying Management’s Annual Report on Internal Control Over Financial Reporting within Item 9A. Controls and Procedures. Our responsibility is to express an opinion on Antero Resources Corporation’s internal control over financial reporting based on our audit.
We conducted our audit in accordance with the standards of the Public Company Accounting Oversight Board (United States). Those standards require that we plan and perform the audit to obtain reasonable assurance about whether effective internal control over financial reporting was maintained in all material respects. Our audit included obtaining an understanding of internal control over financial reporting, assessing the risk that a material weakness exists, and testing and evaluating the design and operating effectiveness of internal control based on the assessed risk. Our audit also included performing such other procedures as we considered necessary in the circumstances. We believe that our audit provides a reasonable basis for our opinion.
A company’s internal control over financial reporting is a process designed to provide reasonable assurance regarding the reliability of financial reporting and the preparation of financial statements for external purposes in accordance with generally accepted accounting principles. A company’s internal control over financial reporting includes those policies and procedures that (1) pertain to the maintenance of records that, in reasonable detail, accurately and fairly reflect the transactions and dispositions of the assets of the company; (2) provide reasonable assurance that the transactions are recorded as necessary to permit preparation of financial statements in accordance with generally accepted accounting principles, and that receipts and expenditures of the company are being made only in accordance with authorizations of management and directors of the company; and (3) provide reasonable assurance regarding prevention or timely detection of unauthorized acquisition, use, or disposition of the company’s assets that could have a material effect on the financial statements.
Because of its inherent limitations, internal control over financial reporting may not prevent or detect misstatements. Also, projections of any evaluation of effectiveness to future periods are subject to the risk that controls may become inadequate because of changes in conditions, or that the degree of compliance with the policies or procedures may deteriorate.
In our opinion, Antero Resources Corporation maintained, in all material respects, effective internal control over financial reporting as of December 31, 2015, based on criteria established in Internal Control – Integrated Framework (2013) issued by the COSO.
We have also audited, in accordance with the standards of the Public Company Accounting Oversight Board (United States), the consolidated balance sheets of Antero Resources Corporation and subsidiaries as of December 31, 2014 and 2015, and the related consolidated statements of operations and comprehensive income (loss), equity, and cash flows for each of the years in the three-year period ended December 31, 2015, and our report dated February 24, 2016 expressed an unqualified opinion on those consolidated financial statements.
/s/ KPMG LLP
Denver, Colorado
February 24, 2016
ANTERO RESOURCES CORPORATION
Consolidated Balance Sheets
December 31, 2014 and 2015
(In thousands, except share and per share amounts)
|
|
|
|
|
|
|
|
|
|
|
|
2014
|
|
2015
|
|
|
Assets
|
|
|
Current assets:
|
|
|
|
|
|
|
|
|
Cash and cash equivalents
|
|
$
|
245,979
|
|
|
23,473
|
|
|
Accounts receivable, net of allowance for doubtful accounts of $1,251 in 2014 and $1,195 in 2015
|
|
|
116,203
|
|
|
79,404
|
|
|
Accrued revenue
|
|
|
191,558
|
|
|
128,242
|
|
|
Derivative instruments
|
|
|
692,554
|
|
|
1,009,030
|
|
|
Other current assets
|
|
|
5,866
|
|
|
8,087
|
|
|
Total current assets
|
|
|
1,252,160
|
|
|
1,248,236
|
|
|
Property and equipment:
|
|
|
|
|
|
|
|
|
Natural gas properties, at cost (successful efforts method):
|
|
|
|
|
|
|
|
|
Unproved properties
|
|
|
2,060,936
|
|
|
1,996,081
|
|
|
Proved properties
|
|
|
6,515,221
|
|
|
8,211,106
|
|
|
Water handling and treatment systems
|
|
|
421,012
|
|
|
565,616
|
|
|
Gathering systems and facilities
|
|
|
1,197,239
|
|
|
1,502,396
|
|
|
Other property and equipment
|
|
|
37,687
|
|
|
46,415
|
|
|
|
|
|
10,232,095
|
|
|
12,321,614
|
|
|
Less accumulated depletion, depreciation, and amortization
|
|
|
(879,643)
|
|
|
(1,589,372)
|
|
|
Property and equipment, net
|
|
|
9,352,452
|
|
|
10,732,242
|
|
|
Derivative instruments
|
|
|
899,997
|
|
|
2,108,450
|
|
|
Other assets
|
|
|
68,886
|
|
|
66,296
|
|
|
Total assets
|
|
$
|
11,573,495
|
|
|
14,155,224
|
|
|
|
|
|
|
|
|
|
|
|
Liabilities and Equity
|
|
|
Current liabilities:
|
|
|
|
|
|
|
|
|
Accounts payable
|
|
$
|
531,564
|
|
|
364,160
|
|
|
Accrued liabilities
|
|
|
168,614
|
|
|
194,076
|
|
|
Revenue distributions payable
|
|
|
182,352
|
|
|
129,949
|
|
|
Other current liabilities
|
|
|
12,202
|
|
|
19,085
|
|
|
Total current liabilities
|
|
|
894,732
|
|
|
707,270
|
|
|
Long-term liabilities:
|
|
|
|
|
|
|
|
|
Long-term debt
|
|
|
4,362,550
|
|
|
4,708,513
|
|
|
Deferred income tax liability
|
|
|
794,796
|
|
|
1,370,686
|
|
|
Other liabilities
|
|
|
47,587
|
|
|
82,077
|
|
|
Total liabilities
|
|
|
6,099,665
|
|
|
6,868,546
|
|
|
Commitments and contingencies (notes 13 and 14)
|
|
|
|
|
|
|
|
|
Equity:
|
|
|
|
|
|
|
|
|
Stockholders' equity:
|
|
|
|
|
|
|
|
|
Preferred stock, $0.01 par value; authorized - 50,000,000 shares; none issued
|
|
|
—
|
|
|
—
|
|
|
Common stock, $0.01 par value; authorized - 1,000,000,000 shares; issued and outstanding 262,071,642 shares and 277,035,558 shares, respectively
|
|
|
2,621
|
|
|
2,770
|
|
|
Additional paid-in capital
|
|
|
3,513,725
|
|
|
4,122,811
|
|
|
Accumulated earnings
|
|
|
867,447
|
|
|
1,808,811
|
|
|
Total stockholders' equity
|
|
|
4,383,793
|
|
|
5,934,392
|
|
|
Noncontrolling interest in consolidated subsidiary
|
|
|
1,090,037
|
|
|
1,352,286
|
|
|
Total equity
|
|
|
5,473,830
|
|
|
7,286,678
|
|
|
Total liabilities and equity
|
|
$
|
11,573,495
|
|
|
14,155,224
|
|
See accompanying notes to consolidated financial statements.
ANTERO RESOURCES CORPORATION
Consolidated Statements of Operations and Comprehensive Income (Loss)
Years Ended December 31, 2013, 2014, and 2015
(In thousands, except share and per share amounts)
|
|
|
|
|
|
|
|
|
|
|
|
|
|
|
2013
|
|
2014
|
|
2015
|
|
|
Revenue:
|
|
|
|
|
|
|
|
|
|
|
|
Natural gas sales
|
|
$
|
689,198
|
|
|
1,301,349
|
|
|
1,039,892
|
|
|
Natural gas liquids sales
|
|
|
111,663
|
|
|
328,323
|
|
|
264,483
|
|
|
Oil sales
|
|
|
20,584
|
|
|
107,080
|
|
|
70,753
|
|
|
Gathering, compression, and water handling and treatment
|
|
|
—
|
|
|
22,075
|
|
|
22,000
|
|
|
Marketing
|
|
|
—
|
|
|
53,604
|
|
|
176,229
|
|
|
Commodity derivative fair value gains
|
|
|
491,689
|
|
|
868,201
|
|
|
2,381,501
|
|
|
Gain on sale of gathering system
|
|
|
—
|
|
|
40,000
|
|
|
—
|
|
|
Total revenue
|
|
|
1,313,134
|
|
|
2,720,632
|
|
|
3,954,858
|
|
|
Operating expenses:
|
|
|
|
|
|
|
|
|
|
|
|
Lease operating
|
|
|
9,439
|
|
|
29,341
|
|
|
36,011
|
|
|
Gathering, compression, processing, and transportation
|
|
|
218,428
|
|
|
461,413
|
|
|
659,361
|
|
|
Production and ad valorem taxes
|
|
|
50,481
|
|
|
87,918
|
|
|
78,325
|
|
|
Marketing
|
|
|
—
|
|
|
103,435
|
|
|
299,062
|
|
|
Exploration
|
|
|
22,272
|
|
|
27,893
|
|
|
3,846
|
|
|
Impairment of unproved properties
|
|
|
10,928
|
|
|
15,198
|
|
|
104,321
|
|
|
Depletion, depreciation, and amortization
|
|
|
233,876
|
|
|
477,896
|
|
|
709,763
|
|
|
Accretion of asset retirement obligations
|
|
|
1,065
|
|
|
1,271
|
|
|
1,655
|
|
|
General and administrative (including equity-based compensation expense of $365,280, $112,252, and $97,877 in 2013, 2014, and 2015, respectively)
|
|
|
425,438
|
|
|
216,533
|
|
|
233,697
|
|
|
Contract termination and rig stacking
|
|
|
—
|
|
|
—
|
|
|
38,531
|
|
|
Total operating expenses
|
|
|
971,927
|
|
|
1,420,898
|
|
|
2,164,572
|
|
|
Operating income
|
|
|
341,207
|
|
|
1,299,734
|
|
|
1,790,286
|
|
|
Other expenses:
|
|
|
|
|
|
|
|
|
|
|
|
Interest
|
|
|
(136,617)
|
|
|
(160,051)
|
|
|
(234,400)
|
|
|
Loss on early extinguishment of debt
|
|
|
(42,567)
|
|
|
(20,386)
|
|
|
—
|
|
|
Total other expenses
|
|
|
(179,184)
|
|
|
(180,437)
|
|
|
(234,400)
|
|
|
Income from continuing operations before income taxes and discontinued operations
|
|
|
162,023
|
|
|
1,119,297
|
|
|
1,555,886
|
|
|
Provision for income tax expense
|
|
|
(186,210)
|
|
|
(445,672)
|
|
|
(575,890)
|
|
|
Income (loss) from continuing operations
|
|
|
(24,187)
|
|
|
673,625
|
|
|
979,996
|
|
|
Discontinued operations:
|
|
|
|
|
|
|
|
|
|
|
|
Income from sale of discontinued operations, net of income tax expense of $3,249 and $1,354 in 2013 and 2014, respectively
|
|
|
5,257
|
|
|
2,210
|
|
|
—
|
|
|
Net income (loss) and comprehensive income (loss) including noncontrolling interest
|
|
|
(18,930)
|
|
|
675,835
|
|
|
979,996
|
|
|
Net income and comprehensive income attributable to noncontrolling interest
|
|
|
—
|
|
|
2,248
|
|
|
38,632
|
|
|
Net income (loss) and comprehensive income (loss) attributable to Antero Resources Corporation
|
|
$
|
(18,930)
|
|
|
673,587
|
|
|
941,364
|
|
|
|
|
|
|
|
|
|
|
|
|
|
|
Earnings (loss) per common share:
|
|
|
|
|
|
|
|
|
|
|
|
Continuing operations
|
|
$
|
(0.09)
|
|
|
2.56
|
|
|
3.43
|
|
|
Discontinued operations
|
|
|
0.02
|
|
|
0.01
|
|
|
—
|
|
|
Total
|
|
$
|
(0.07)
|
|
|
2.57
|
|
|
3.43
|
|
|
|
|
|
|
|
|
|
|
|
|
|
|
Earnings (loss) per common share—assuming dilution:
|
|
|
|
|
|
|
|
|
|
|
|
Continuing operations
|
|
$
|
(0.09)
|
|
|
2.56
|
|
|
3.43
|
|
|
Discontinued operations
|
|
|
0.02
|
|
|
0.01
|
|
|
—
|
|
|
Total
|
|
$
|
(0.07)
|
|
|
2.57
|
|
|
3.43
|
|
|
|
|
|
|
|
|
|
|
|
|
|
|
Weighted average number of shares outstanding:
|
|
|
|
|
|
|
|
|
|
|
|
Basic
|
|
|
262,049,659
|
|
|
262,053,868
|
|
|
274,122,567
|
|
|
Diluted
|
|
|
262,049,659
|
|
|
262,068,106
|
|
|
274,143,341
|
|
See accompanying notes to consolidated financial statements.
ANTERO RESOURCES CORPORATION
Consolidated Statements of Equity
Years Ended December 31, 2013, 2014, and 2015
(In thousands)
|
|
|
|
|
|
|
|
|
|
|
|
|
|
|
|
|
|
|
|
|
|
|
|
|
|
|
Members'
|
|
Common Stock
|
|
Additional paid-
|
|
Accumulated
|
|
Noncontrolling
|
|
Total
|
|
|
|
|
equity
|
|
Shares
|
|
Amount
|
|
in capital
|
|
earnings
|
|
interest
|
|
equity
|
|
|
Balances, December 31, 2012
|
|
$
|
1,460,947
|
|
|
—
|
|
|
—
|
|
|
—
|
|
|
212,790
|
|
|
—
|
|
|
1,673,737
|
|
|
Merger of Antero Resources LLC and Antero Resources Corporation
|
|
|
(1,460,947)
|
|
|
224,375
|
|
|
2,244
|
|
|
1,458,703
|
|
|
—
|
|
|
—
|
|
|
—
|
|
|
Issuance of common stock in initial public offering, net of underwriter discounts and offering costs
|
|
|
—
|
|
|
37,675
|
|
|
376
|
|
|
1,578,197
|
|
|
—
|
|
|
—
|
|
|
1,578,573
|
|
|
Equity-based compensation
|
|
|
—
|
|
|
—
|
|
|
—
|
|
|
365,280
|
|
|
—
|
|
|
—
|
|
|
365,280
|
|
|
Net loss and comprehensive loss
|
|
|
—
|
|
|
—
|
|
|
—
|
|
|
—
|
|
|
(18,930)
|
|
|
—
|
|
|
(18,930)
|
|
|
Balances, December 31, 2013
|
|
|
—
|
|
|
262,050
|
|
|
2,620
|
|
|
3,402,180
|
|
|
193,860
|
|
|
—
|
|
|
3,598,660
|
|
|
Issuance of common stock upon vesting of equity-based compensation awards, net of shares withheld for income taxes
|
|
|
—
|
|
|
22
|
|
|
1
|
|
|
(142)
|
|
|
—
|
|
|
—
|
|
|
(141)
|
|
|
Equity-based compensation
|
|
|
—
|
|
|
—
|
|
|
—
|
|
|
111,687
|
|
|
—
|
|
|
565
|
|
|
112,252
|
|
|
Issuance of common units in subsidiary - Antero Midstream Partners LP
|
|
|
—
|
|
|
—
|
|
|
—
|
|
|
—
|
|
|
—
|
|
|
1,087,224
|
|
|
1,087,224
|
|
|
Net income and comprehensive income
|
|
|
—
|
|
|
—
|
|
|
—
|
|
|
—
|
|
|
673,587
|
|
|
2,248
|
|
|
675,835
|
|
|
Balances, December 31, 2014
|
|
|
—
|
|
|
262,072
|
|
|
2,621
|
|
|
3,513,725
|
|
|
867,447
|
|
|
1,090,037
|
|
|
5,473,830
|
|
|
Issuance of common stock in public offering, net of underwriter discounts and offering costs
|
|
|
—
|
|
|
14,700
|
|
|
147
|
|
|
537,685
|
|
|
—
|
|
|
—
|
|
|
537,832
|
|
|
Issuance of common units in Antero Midstream Partners LP
|
|
|
—
|
|
|
—
|
|
|
—
|
|
|
—
|
|
|
—
|
|
|
240,703
|
|
|
240,703
|
|
|
Issuance of common stock upon vesting of equity-based compensation awards, net of shares withheld for income tax withholdings
|
|
|
—
|
|
|
264
|
|
|
2
|
|
|
(4,627)
|
|
|
—
|
|
|
—
|
|
|
(4,625)
|
|
|
Issuance of common units in Antero Midstream Partners LP upon vesting of equity-based compensation awards, net of units withheld for income tax withholdings
|
|
|
—
|
|
|
—
|
|
|
—
|
|
|
(17,272)
|
|
|
—
|
|
|
12,466
|
|
|
(4,806)
|
|
|
Equity-based compensation
|
|
|
—
|
|
|
—
|
|
|
—
|
|
|
93,300
|
|
|
—
|
|
|
4,577
|
|
|
97,877
|
|
|
Net income and comprehensive income
|
|
|
—
|
|
|
—
|
|
|
—
|
|
|
—
|
|
|
941,364
|
|
|
38,632
|
|
|
979,996
|
|
|
Distributions to noncontrolling interests
|
|
|
—
|
|
|
—
|
|
|
—
|
|
|
—
|
|
|
—
|
|
|
(34,129)
|
|
|
(34,129)
|
|
|
Balances, December 31, 2015
|
|
$
|
—
|
|
|
277,036
|
|
|
2,770
|
|
|
4,122,811
|
|
|
1,808,811
|
|
|
1,352,286
|
|
|
7,286,678
|
|
See accompanying notes to consolidated financial statements.
ANTERO RESOURCES CORPORATION
Consolidated Statements of Cash Flows
Years Ended December 31, 2013, 2014, and 2015
(In thousands)
|
|
|
|
|
|
|
|
|
|
|
|
|
|
|
2013
|
|
2014
|
|
2015
|
|
|
Cash flows from operating activities:
|
|
|
|
|
|
|
|
|
|
|
|
Net income (loss) including noncontrolling interest
|
|
$
|
(18,930)
|
|
|
675,835
|
|
|
979,996
|
|
|
Adjustment to reconcile net income to net cash provided by operating activities:
|
|
|
|
|
|
|
|
|
|
|
|
Depletion, depreciation, amortization, and accretion
|
|
|
234,941
|
|
|
479,167
|
|
|
711,418
|
|
|
Impairment of unproved properties
|
|
|
10,928
|
|
|
15,198
|
|
|
104,321
|
|
|
Derivative fair value gains
|
|
|
(491,689)
|
|
|
(868,201)
|
|
|
(2,381,501)
|
|
|
Gains on settled derivatives
|
|
|
163,570
|
|
|
135,784
|
|
|
856,572
|
|
|
Deferred income tax expense
|
|
|
190,210
|
|
|
445,672
|
|
|
575,890
|
|
|
Gain on sale of assets
|
|
|
—
|
|
|
(40,000)
|
|
|
—
|
|
|
Equity-based compensation expense
|
|
|
365,280
|
|
|
112,252
|
|
|
97,877
|
|
|
Loss on early extinguishment of debt
|
|
|
42,567
|
|
|
20,386
|
|
|
—
|
|
|
Gain on sale of discontinued operations
|
|
|
(8,506)
|
|
|
(3,564)
|
|
|
—
|
|
|
Deferred income tax expense—discontinued operations
|
|
|
3,249
|
|
|
1,354
|
|
|
—
|
|
|
Other
|
|
|
1,173
|
|
|
6,433
|
|
|
31,741
|
|
|
Changes in current assets and liabilities:
|
|
|
|
|
|
|
|
|
|
|
|
Accounts receivable
|
|
|
(9,314)
|
|
|
(45,593)
|
|
|
(3,201)
|
|
|
Accrued revenue
|
|
|
(50,156)
|
|
|
(94,733)
|
|
|
63,316
|
|
|
Other current assets
|
|
|
19,543
|
|
|
(2,891)
|
|
|
(2,221)
|
|
|
Accounts payable
|
|
|
1,039
|
|
|
(11,710)
|
|
|
5,200
|
|
|
Accrued liabilities
|
|
|
26,803
|
|
|
85,953
|
|
|
13,210
|
|
|
Revenue distributions payable
|
|
|
50,552
|
|
|
85,763
|
|
|
(52,403)
|
|
|
Other current liabilities
|
|
|
3,447
|
|
|
1,016
|
|
|
6,166
|
|
|
Net cash provided by operating activities
|
|
|
534,707
|
|
|
998,121
|
|
|
1,006,381
|
|
|
Cash flows used in investing activities:
|
|
|
|
|
|
|
|
|
|
|
|
Additions to proved properties
|
|
|
(15,300)
|
|
|
(64,066)
|
|
|
—
|
|
|
Additions to unproved properties
|
|
|
(440,825)
|
|
|
(777,422)
|
|
|
(198,694)
|
|
|
Drilling and completion costs
|
|
|
(1,615,965)
|
|
|
(2,477,150)
|
|
|
(1,651,282)
|
|
|
Additions to water handling and treatment systems
|
|
|
(203,790)
|
|
|
(196,675)
|
|
|
(131,051)
|
|
|
Additions to gathering systems and facilities
|
|
|
(389,453)
|
|
|
(558,037)
|
|
|
(360,287)
|
|
|
Additions to other property and equipment
|
|
|
(6,240)
|
|
|
(13,218)
|
|
|
(6,595)
|
|
|
Change in other assets
|
|
|
(2,019)
|
|
|
(3,082)
|
|
|
9,750
|
|
|
Proceeds from asset sales
|
|
|
—
|
|
|
—
|
|
|
40,000
|
|
|
Net cash used in investing activities
|
|
|
(2,673,592)
|
|
|
(4,089,650)
|
|
|
(2,298,159)
|
|
|
Cash flows from financing activities:
|
|
|
|
|
|
|
|
|
|
|
|
Issuance of common stock
|
|
|
1,578,573
|
|
|
—
|
|
|
537,832
|
|
|
Issuance of common units in Antero Midstream Partners LP
|
|
|
—
|
|
|
1,087,224
|
|
|
240,703
|
|
|
Issuance of senior notes
|
|
|
1,231,750
|
|
|
1,102,500
|
|
|
750,000
|
|
|
Repayment of senior notes
|
|
|
(690,000)
|
|
|
(260,000)
|
|
|
—
|
|
|
Borrowings (repayments) on bank credit facilities, net
|
|
|
71,000
|
|
|
1,442,000
|
|
|
(403,000)
|
|
|
Make-whole premium on debt extinguished
|
|
|
(33,041)
|
|
|
(17,383)
|
|
|
—
|
|
|
Payments of deferred financing costs
|
|
|
(20,899)
|
|
|
(31,543)
|
|
|
(17,293)
|
|
|
Distributions to noncontrolling interest in consolidated subsidiary
|
|
|
—
|
|
|
—
|
|
|
(34,129)
|
|
|
Other
|
|
|
—
|
|
|
(2,777)
|
|
|
(4,841)
|
|
|
Net cash provided by financing activities
|
|
|
2,137,383
|
|
|
3,320,021
|
|
|
1,069,272
|
|
|
Net increase (decrease) in cash and cash equivalents
|
|
|
(1,502)
|
|
|
228,492
|
|
|
(222,506)
|
|
|
Cash and cash equivalents, beginning of period
|
|
|
18,989
|
|
|
17,487
|
|
|
245,979
|
|
|
Cash and cash equivalents, end of period
|
|
$
|
17,487
|
|
|
245,979
|
|
|
23,473
|
|
|
|
|
|
|
|
|
|
|
|
|
|
|
Supplemental disclosure of cash flow information:
|
|
|
|
|
|
|
|
|
|
|
|
Cash paid during the period for interest
|
|
$
|
117,832
|
|
|
163,055
|
|
|
219,945
|
|
|
Supplemental disclosure of noncash investing activities:
|
|
|
|
|
|
|
|
|
|
|
|
Increase (decrease) in accounts payable and accrued liabilities for additions to property and equipment
|
|
$
|
188,123
|
|
|
181,591
|
|
|
(169,783)
|
|
See accompanying notes to consolidated financial statements.
Table of Contents
ANTERO RESOURCES CORPORATION
Notes to Consolidated Financial Statements
Years Ended December 31, 2013, 2014, and 2015
(1) Business and Organization
Antero Resources Corporation (individually referred to as “Antero”) and its consolidated subsidiaries (collectively referred to as the “Company”) are engaged in the exploration, development, and acquisition of natural gas, natural gas liquids (“NGLs”), and oil properties in the Appalachian Basin in West Virginia, Ohio, and Pennsylvania. The Company targets large, repeatable resource plays where horizontal drilling and advanced fracture stimulation technologies provide the means to economically develop and produce natural gas, NGLs, and oil from unconventional formations. Through its consolidated subsidiary, Antero Midstream Partners LP, a publicly-traded limited partnership (“Antero Midstream”), the Company has water handling and treatment operations and gathering and compression operations in the Appalachian Basin. The Company’s corporate headquarters are located in Denver, Colorado.
(2) Summary of Significant Accounting Policies
(a) Basis of Presentation
The accompanying consolidated financial statements of the Company have been prepared in accordance with accounting principles generally accepted in the United States (“GAAP”). In the opinion of management, the accompanying consolidated financial statements include all adjustments (consisting of normal and recurring accruals) considered necessary to present fairly the Company’s financial position as of December 31, 2014 and 2015, and the results of its operations and its cash flows for the years ended December 31, 2013, 2014, and 2015. The Company has no items of other comprehensive income or loss; therefore, its net income or loss is identical to its comprehensive income or loss.
As of the date these financial statements were filed with the Securities and Exchange Commission, the Company completed its evaluation of potential subsequent events for disclosure and no items requiring disclosure were identified.
(b) Principles of Consolidation
The accompanying consolidated financial statements include the accounts of Antero Resources Corporation, its wholly-owned subsidiaries, any entities in which the Company owns a controlling interest, and variable interest entities in which the Company is the primary beneficiary. All significant intercompany accounts and transactions have been eliminated in the Company’s consolidated financial statements. Noncontrolling interest in the Company’s consolidated financial statements represents the interests in Antero Midstream which are owned by third-party individuals or entities, or Antero Midstream’s general partner. An affiliate of the Company owns the general partner interest in Antero Midstream. Noncontrolling interest is included as a component of equity in the Company’s consolidated balance sheets.
(c) Use of Estimates
The preparation of consolidated financial statements in conformity with GAAP requires management to make estimates and assumptions that affect the reported assets and liabilities and disclosure of contingent assets and liabilities at the date of the consolidated financial statements, as well as the reported amounts of revenues and expenses during the reporting period. Changes in facts and circumstances or discovery of new information may result in revised estimates, and actual results could differ from those estimates.
The Company’s consolidated financial statements are based on a number of significant estimates including estimates of natural gas, NGLs, and oil reserve quantities, which are the basis for the calculation of depletion and impairment of oil and gas properties. Reserve estimates by their nature are inherently imprecise. Other items in the Company’s consolidated financial statements which involve the use of significant estimates include derivative assets and liabilities, accrued revenue, deferred income taxes, equity-based compensation, asset retirement obligations, depreciation, amortization, and commitments and contingencies.
(d) Risks and Uncertainties
Historically, the markets for natural gas, NGLs, and oil have experienced significant price fluctuations. Price fluctuations can result from variations in weather, levels of production in the region, availability of transportation capacity to other regions of the
Table of Contents
ANTERO RESOURCES CORPORATION
Notes to Consolidated Financial Statements (Continued)
Years Ended December 31, 2013, 2014, and 2015
country, and various other factors. Increases or decreases in the prices the Company receives for its production could have a significant impact on the Company’s future results of operations and reserve quantities.
(e) Cash and Cash Equivalents
The Company considers all liquid investments purchased with an initial maturity of three months or less to be cash equivalents. The carrying value of cash and cash equivalents approximates fair value due to the short‑term nature of these instruments.
(f) Oil and Gas Properties
The Company accounts for its natural gas and crude oil exploration and development activities under the successful efforts method of accounting. Under the successful efforts method, the costs incurred to acquire, drill, and complete productive wells, development wells, and undeveloped leases are capitalized. Oil and gas lease acquisition costs are also capitalized. Exploration costs, including personnel and other internal costs, geological and geophysical expenses, delay rentals for gas and oil leases, and costs associated with unsuccessful lease acquisitions are charged to expense as incurred. Exploratory drilling costs are initially capitalized, but charged to expense if and when the Company determines that the well does not contain reserves in commercially viable quantities. The Company reviews exploration costs related to wells‑in‑progress at the end of each quarter and makes a determination, based on known results of drilling at that time, whether the costs should continue to be capitalized pending further well testing and results, or charged to expense. The Company incurred no such charges during the years ended December 31, 2013, 2014, and 2015. The sale of a partial interest in a proved property is accounted for as a cost recovery, and no gain or loss is recognized as long as this treatment does not significantly affect the units‑of‑production amortization rate. A gain or loss is recognized for all other sales of producing properties.
Unproved properties with significant acquisition costs are assessed for impairment on a property‑by‑property basis, and any impairment in value is charged to expense. Impairment is assessed based on remaining lease terms, drilling results, reservoir performance, commodity price outlooks, and future plans to develop acreage. Other unproved properties are assessed for impairment on an aggregate basis. Unproved properties and the related costs are transferred to proved properties when reserves are discovered on, or otherwise attributed, to the property. Proceeds from sales of partial interests in unproved properties are accounted for as a recovery of cost without recognition of any gain or loss until the cost has been recovered. Impairment of unproved properties for leases which have expired, or are expected to expire, was $10.9 million, $15.2 million, and $104.3 million for the years ended December 31, 2013, 2014, and 2015, respectively.
The Company evaluates the carrying amount of its proved natural gas, NGLs, and oil properties for impairment on a geological reservoir basis whenever events or changes in circumstances indicate that a property’s carrying amount may not be recoverable. If the carrying amount exceeds the estimated undiscounted future cash flows, the Company would estimate the fair value of its properties and record an impairment charge for any excess of the carrying amount of the properties over the estimated fair value of the properties. Factors used to determine fair value may include estimates of proved reserves, future commodity prices, future production estimates, anticipated capital expenditures, and a commensurate discount rate. Because estimated undiscounted future cash flows have exceeded the carrying value of the Company’s proved properties at the end of each quarter, it has not been necessary for the Company to determine the fair value of its properties under GAAP for successful efforts accounting. As a result, the Company has not recorded any impairment expenses associated with its properties during the year ended December 31, 2015. Additionally, the Company did not record any impairment expenses for proved properties during the years ended December 31, 2013 and 2014.
At December 31, 2015, the Company did not have significant capitalized costs related to exploratory wells‑in‑progress which were pending determination of proved reserves. The Company also had no significant costs which have been deferred for longer than one year pending determination of proved reserves at December 31, 2015.
The provision for depletion, depreciation, and amortization of oil and gas properties is calculated on a geological reservoir basis using the units‑of‑production method. Depletion, depreciation, and amortization expense for oil and gas properties was $219.8 million, $418.7 million, and $614.7 million for the years ended December 31, 2013, 2014, and 2015, respectively.
Table of Contents
ANTERO RESOURCES CORPORATION
Notes to Consolidated Financial Statements (Continued)
Years Ended December 31, 2013, 2014, and 2015
(g) Gathering Pipelines, Compressor Stations, and Water Handling and Treatment Systems
Expenditures for construction, installation, major additions, and improvements to property, plant, and equipment that is not directly related to production are capitalized, whereas minor replacements, maintenance, and repairs are expensed as incurred. Gathering pipelines and compressor stations are depreciated using the straight‑line method over their estimated useful lives of 20 years. Water handling and treatment systems are depreciated using the straight-line method over their estimated useful lives of 5 to 20 years. Depreciation expense for gathering pipelines, compressor stations, and water handling and treatment systems was $11.9 million, $53.2 million, and $87.4 million for the years ended December 31, 2013, 2014, and 2015, respectively. A gain or loss is recognized upon the sale or disposal of property and equipment.
(h) Impairment of Long‑Lived Assets Other than Oil and Gas Properties
The Company evaluates its long‑lived assets other than natural gas properties for impairment when events or changes in circumstances indicate that the related carrying values of the assets may not be recoverable. Generally, the basis for making such assessments is undiscounted future cash flow projections for the unit being assessed. If the carrying values of the assets are deemed not recoverable, the carrying values are reduced to the estimated fair value, which is based on discounted future cash flows or other techniques, as appropriate. There were no impairments for such assets during the years ended December 31, 2013, 2014, and 2015.
(i) Other Property and Equipment
Other property and equipment assets are depreciated using the straight‑line method over their estimated useful lives, which range from 2 to 20 years. Depreciation expense for other property and equipment was $2.2 million, $5.9 million, and $7.7 million for the years ended December 31, 2013, 2014, and 2015, respectively. A gain or loss is recognized upon the sale or disposal of property and equipment.
(j) Deferred Financing Costs
Deferred financing costs represent loan origination fees, initial purchasers’ discounts, and other borrowing costs, and are included in noncurrent other assets on the consolidated balance sheets. These costs are amortized over the term of the related debt instrument using the effective interest method. The Company charges expense for unamortized deferred financing costs if credit facilities are retired prior to their maturity date. At December 31, 2015, the Company had $59 million of unamortized deferred financing costs included in other long‑term assets. The amounts amortized and the write‑off of previously deferred debt issuance costs were $15.8 million, $11.0 million, and $10.1 million for the years ended December 31, 2013, 2014, and 2015, respectively.
(k) Derivative Financial Instruments
In order to manage its exposure to natural gas, NGLs, and oil price volatility, the Company enters into derivative transactions from time to time, including commodity swap agreements, basis swap agreements, collar agreements, and other similar agreements relating to the price risk associated with a portion of its production. To the extent legal right of offset exists with a counterparty, the Company reports derivative assets and liabilities on a net basis. The Company has exposure to credit risk to the extent that the counterparty is unable to satisfy its settlement obligations. The Company actively monitors the creditworthiness of counterparties and assesses the impact, if any, on its derivative position.
The Company records derivative instruments on the consolidated balance sheets as either an asset or liability measured at fair value and records changes in the fair value of derivatives in current earnings as they occur. Changes in the fair value of commodity derivatives are classified as revenues on the Company’s consolidated statements of operations. The Company’s derivatives have not been designated as hedges for accounting purposes.
(l) Asset Retirement Obligations
The Company is obligated to dispose of certain long‑lived assets upon their abandonment. The Company’s asset retirement obligations (“ARO”) relate primarily to its obligation to plug and abandon oil and gas wells at the end of their lives. The ARO is recorded at its estimated fair value, measured by reference to the expected future cash outflows required to satisfy the retirement
Table of Contents
ANTERO RESOURCES CORPORATION
Notes to Consolidated Financial Statements (Continued)
Years Ended December 31, 2013, 2014, and 2015
obligation, which is then discounted at the Company’s credit‑adjusted, risk‑free interest rate. Revisions to estimated ARO can result from changes in retirement cost estimates and changes in the estimated timing of abandonment. The fair value of the liability is added to the carrying amount of the associated asset, and this additional carrying amount is depreciated over the life of the asset. The liability is accreted at the end of each period through charges to operating expense. If the obligation is settled for an amount other than the carrying amount of the liability, the Company will recognize a gain or loss on settlement.
The Company delivers natural gas through its gathering assets and delivers water through its water handling and treatment assets and may become obligated by regulatory or other requirements to remove certain facilities or perform other remediation upon retirement of these assets. However, the Company cannot reasonably predict when production from existing reserves of the fields in which it operates will cease. In the absence of such information, management is not able to make a reasonable estimate of when future dismantlement and removal dates will occur; therefore, the Company has not recorded asset retirement obligations related to its gathering and water handling and treatment assets.
(m) Environmental Liabilities
Environmental expenditures that relate to an existing condition caused by past operations, and that do not contribute to current or future revenue generation, are expensed as incurred. Liabilities are accrued when environmental assessments and/or clean up is probable, and the costs can be reasonably estimated. These liabilities are adjusted as additional information becomes available or circumstances change. As of December 31, 2014 and 2015, the Company did not have a material amount accrued for any environmental liabilities, nor has the Company been cited for any environmental violations that are likely to have a material adverse effect on future capital expenditures or operating results of the Company.
(n) Natural Gas, NGLs, and Oil Revenues
Sales of natural gas, NGLs, and crude oil are recognized when the products are delivered to the purchaser and title transfers to the purchaser. Payment is generally received one month after the sale has occurred. Variances between estimated sales and actual amounts received are recorded in the month payment is received and are not material. The Company recognizes natural gas revenues based on its entitlement share of natural gas that is produced based on its working interests in the properties. The Company records a revenue distribution payable to the extent it receives more than its proportionate share of natural gas revenues. At December 31, 2014 and 2015, the Company had no significant imbalance positions.
(o) Concentrations of Credit Risk
The Company’s revenues are derived principally from uncollateralized sales to purchasers in the oil and gas industry. The concentration of credit risk in a single industry affects the Company’s overall exposure to credit risk because purchasers may be similarly affected by changes in economic and other conditions. The Company has not experienced significant credit losses on its receivables.
The Company’s sales to major customers (purchases in excess of 10% of total sales) for the years ended December 31, 2013, 2014, and 2015 are as follows:
|
|
|
|
|
|
|
|
|
|
|
|
|
|
2013
|
|
|
2014
|
|
|
2015
|
|
|
Company A
|
|
—
|
%
|
|
5
|
%
|
|
19
|
%
|
|
Company B
|
|
30
|
|
|
29
|
|
|
18
|
|
|
Company C
|
|
14
|
|
|
16
|
|
|
13
|
|
|
Company D
|
|
8
|
|
|
12
|
|
|
9
|
|
|
All others
|
|
48
|
|
|
38
|
|
|
41
|
|
|
|
|
100
|
%
|
|
100
|
%
|
|
100
|
%
|
Although a substantial portion of the Company’s production is purchased by these major customers, the Company does not believe the loss of any one or several customers would have a material adverse effect on its business, as other customers or markets would be accessible.
Table of Contents
ANTERO RESOURCES CORPORATION
Notes to Consolidated Financial Statements (Continued)
Years Ended December 31, 2013, 2014, and 2015
The Company is also exposed to credit risk on its commodity derivative portfolio. Any default by the counterparties to these derivative contracts when they become due could have a material adverse effect on the Company’s financial condition and results of operations. The Company has economic hedges in place with fourteen different counterparties, all of which are a lender under Antero’s Credit Facility. The fair value of the Company’s commodity derivative contracts of approximately $3.1 billion at December 31, 2015 includes the following values by bank counterparty: Morgan Stanley—$691 million; Barclays—$593 million; JP Morgan—$575 million; Citigroup—$362 million; Wells Fargo—$285 million; Scotiabank—$214 million; BNP Paribas—$188 million; Toronto Dominion Bank—$76 million; Fifth Third Bank—$41 million; Canadian Imperial Bank of Commerce—$37 million; Bank of Montreal—$29 million; SunTrust—$17 million; Capital One—$8 million; and Natixis—$1 million. The credit ratings of certain of these banks were downgraded in recent years because of the sovereign debt crisis in Europe. The estimated fair value of commodity derivative assets has been risk adjusted using a discount rate based upon the respective published credit default swap rates (if available, or if not available, a discount rate based on the applicable Reuters bond rating) at December 31, 2015 for each of the European and American banks. The Company believes that all of these institutions currently are acceptable credit risks.
The Company, at times, may have cash in banks in excess of federally insured amounts.
(p) Income Taxes
The Company recognizes deferred tax assets and liabilities for temporary differences resulting from net operating loss carryforwards for income tax purposes and the differences between the financial statement and tax basis of assets and liabilities. The effect of changes in the tax laws or tax rates is recognized in income in the period such changes are enacted. Deferred tax assets are reduced by a valuation allowance when, in the opinion of management, it is more likely than not that some portion, or all, of the deferred tax assets will not be realized.
Unrecognized tax benefits represent potential future tax obligations for uncertain tax positions taken on previously filed tax returns that may not ultimately be sustained. The Company recognizes interest expense related to unrecognized tax benefits in interest expense and fines and penalties for tax-related matters as income tax expense.
(q) Fair Value Measurements
FASB ASC Topic 820, Fair Value Measurements and Disclosures, clarifies the definition of fair value, establishes a framework for measuring fair value, and expands disclosures about fair value measurements. This guidance also relates to all nonfinancial assets and liabilities that are not recognized or disclosed on a recurring basis (e.g., those measured at fair value in a business combination, the initial recognition of asset retirement obligations, and impairments of proved oil and gas properties and other long‑lived assets). The fair value is the price that the Company estimates would be received to sell an asset or paid to transfer a liability in an orderly transaction between market participants at the measurement date. A fair value hierarchy is used to prioritize inputs to valuation techniques used to estimate fair value. An asset or liability subject to the fair value requirements is categorized within the hierarchy based on the lowest level of input that is significant to the fair value measurement. The Company’s assessment of the significance of a particular input to the fair value measurement in its entirety requires judgment and considers factors specific to the asset or liability. The highest priority (Level 1) is given to unadjusted, quoted market prices in active markets for identical assets or liabilities, and the lowest priority (Level 3) is given to unobservable inputs. Level 2 inputs are data, other than quoted prices included within Level 1, which are observable for the asset or liability, either directly or indirectly. Instruments which are valued using Level 2 inputs include non-exchange traded derivatives such as over‑the‑counter commodity price swaps and basis swaps. Valuation models used to measure fair value of these instruments consider various Level 2 inputs including (i) quoted forward prices for commodities, (ii) time value, (iii) quoted forward interest rates, (iv) current market prices and contractual prices for the underlying instruments, (v) risk of nonperformance by the Company and the counterparty, and (vi) other relevant economic measures.
(r) Industry Segments and Geographic Information
Management has evaluated how the Company is organized and managed and has identified the following segments: (1) the exploration, development, and production of natural gas, NGLs, and oil; (2) gathering and compression; (3) water handling and treatment; and (4) marketing of excess firm transportation capacity. The Company identified marketing of excess firm transportation capacity as a new operating segment in 2014.
Table of Contents
ANTERO RESOURCES CORPORATION
Notes to Consolidated Financial Statements (Continued)
Years Ended December 31, 2013, 2014, and 2015
All of the Company’s assets are located in the United States and substantially all of its production revenues are attributable to customers located in the United States.
(s) Marketing Revenues and Expenses
In 2014, the Company commenced activities to purchase and sell third-party natural gas and NGLs and to market its excess firm transportation capacity in order to utilize this excess capacity. Marketing revenues include sales of purchased third-party gas and NGLs, as well as revenues from the release of firm transportation capacity to others. Marketing expenses include the cost of purchased third-party natural gas and NGLs. The Company classifies firm transportation costs related to capacity contracted for in advance of having sufficient production and infrastructure to fully utilize the capacity (excess capacity) as marketing expenses since it is marketing this excess capacity to third parties. Firm transportation for which the Company has sufficient production capacity (even though it may not use the transportation capacity because of alternative delivery points with more favorable pricing) is considered unutilized capacity. The costs of unutilized capacity are charged to transportation expense.
(t) Earnings (loss) per common share
Earnings (loss) per common share for each period is computed by dividing net income (loss) from continuing operations attributable to Antero or income from discontinued operations, as applicable, by the basic weighted average number of shares outstanding during such period. Earnings per common share—assuming dilution for each period is computed giving consideration to the potential dilution from outstanding equity awards, calculated using the treasury stock method. During periods in which the Company incurs a net loss, diluted weighted average shares outstanding are equal to basic weighted average shares outstanding because the effect of all equity awards is antidilutive. The following is a reconciliation of the Company’s basic weighted average shares outstanding to diluted weighted average shares outstanding during the periods presented:
|
|
|
|
|
|
|
|
|
|
|
|
Year ended December 31,
|
|
|
|
|
2013
|
|
2014
|
|
2015
|
|
|
Basic weighted average number of shares outstanding
|
|
262,049,659
|
|
262,053,868
|
|
274,122,567
|
|
|
Add: Dilutive effect of non-vested restricted stock and restricted stock units
|
|
—
|
|
14,238
|
|
20,774
|
|
|
Add: Dilutive effect of outstanding stock options
|
|
—
|
|
—
|
|
—
|
|
|
Diluted weighted average number of shares outstanding
|
|
262,049,659
|
|
262,068,106
|
|
274,143,341
|
|
|
|
|
|
|
|
|
|
|
|
Weighted average number of outstanding equity awards excluded from calculation of diluted earnings per common share(1):
|
|
|
|
|
|
|
|
|
Non-vested restricted stock and restricted stock units
|
|
—
|
|
1,444,023
|
|
2,264,394
|
|
|
Outstanding stock options
|
|
—
|
|
72,592
|
|
553,297
|
|
(1) The potential dilutive effects of these awards were excluded from the computation of earnings per common share—assuming dilution because the inclusion of these awards would have been anti-dilutive.
(u) New Accounting Principle
On November 20, 2015, the FASB issued ASU No. 2015-17, Income Taxes–Balance Sheet Classification of Deferred Taxes, which requires that deferred income tax liabilities and assets be presented in the balance sheet as noncurrent. The new standard becomes effective for the Company on January 1, 2017. However, the Company has elected to early-adopt the standard as of December 31, 2015. The Company has also elected to apply this standard retrospectively; as such, deferred taxes have been recast as noncurrent for all prior periods presented in this Form 10-K. The Company does not believe that this standard has a material impact on its ongoing financial reporting. The retrospective adjustment to the December 31, 2014 consolidated balance sheet is as follows:
|
|
|
|
|
|
|
|
|
|
|
|
|
|
|
As Previously Reported
|
|
Adjustment
|
|
As Adjusted
|
|
|
|
|
December 31, 2014
|
|
Effect
|
|
December 31, 2014
|
|
|
Net deferred income tax liability - current
|
|
$
|
260,373
|
|
|
(260,373)
|
|
|
—
|
|
|
Net deferred income tax liability - long-term
|
|
|
534,423
|
|
|
260,373
|
|
|
794,796
|
|
|
Total net deferred tax liabilities
|
|
$
|
794,796
|
|
|
—
|
|
|
794,796
|
|
Table of Contents
ANTERO RESOURCES CORPORATION
Notes to Consolidated Financial Statements (Continued)
Years Ended December 31, 2013, 2014, and 2015
(3)Antero Midstream Partners LP
In 2014, the Company formed Antero Midstream to own, operate, and develop midstream energy assets to service Antero’s production. Antero Midstream’s assets consist of gathering pipelines and compressor stations, and water handling and treatment facilities, through which it provides services to Antero under long-term, fixed-fee contracts. Antero Resources Midstream Management LLC (“Midstream Management”), a wholly-owned subsidiary of Antero Investment LLC (“Antero Investment”), owns the general partnership interest in Antero Midstream, which allows Midstream Management to manage the business and affairs of Antero Midstream. Midstream Management also holds the incentive distribution rights in Antero Midstream. Antero Midstream is an unrestricted subsidiary as defined by Antero’s bank credit facility and, as such, Antero Midstream is not a guarantor of Antero’s obligations, and Antero is not a guarantor of Antero Midstream’s obligations (see note 16).
On September 23, 2015, Antero contributed (i) all of the outstanding limited liability company interests of Antero Water LLC (“Antero Water”) to Antero Midstream and (ii) all of the assets, contracts, rights, permits and properties owned or leased by Antero and used primarily in connection with the construction, ownership, operation, use or maintenance of Antero’s advanced wastewater treatment complex to be constructed in Doddridge County, West Virginia, to Antero Treatment LLC, a subsidiary of Antero Midstream (collectively, (i) and (ii) are referred to herein as the “Contributed Assets”).
In consideration for the Contributed Assets, Antero Midstream (i) paid to Antero a cash distribution equal to $552 million, less $171 million of assumed debt, (ii) issued to Antero 10,988,421 common units representing limited partner interests in Antero Midstream, (iii) distributed to Antero proceeds of approximately $241 million from a private placement of Antero Midstream common units, and (iv) has agreed to pay Antero (a) $125 million in cash if Antero Midstream delivers 176,295,000 barrels or more of fresh water during the period between January 1, 2017 and December 31, 2019 and (b) an additional $125 million in cash if Antero Midstream delivers 219,200,000 barrels or more of fresh water during the period between January 1, 2018 and December 31, 2020. Antero Midstream borrowed $525 million on its bank credit facility in connection with this transaction.
The transaction was accounted for as a transaction between entities under common control. As a result, the Contributed Assets have been recorded by Antero Midstream at their historical cost. The difference between the historical cost and the consideration transferred to Antero was recorded as an adjustment to partners’ capital on the balance sheet of Antero Midstream.
At December 31, 2014 and December 31, 2015, Antero owned approximately 69.7% and 66.3% of the limited partner interests of Antero Midstream, respectively.
(4) Sale of Piceance and Arkoma Properties—Discontinued Operations
In 2012, the Company sold its Piceance Basin assets in Colorado and its Arkoma Basin assets in Oklahoma. Pre-tax losses recognized in discontinued operations at the time of the transactions were adjusted downward in 2013 and 2014 by $8.5 million and $3.6 million, respectively, for the resolution of certain liabilities recorded at the time of the sales and settlement of final contractual purchase price adjustments.
Income from discontinued operations on the accompanying Consolidated Statement of Operations and Comprehensive Income (Loss) is comprised of the following (in thousands):
|
|
|
|
|
|
|
|
|
|
|
|
|
|
|
Year ended December 31,
|
|
|
|
|
2013
|
|
2014
|
|
2015
|
|
|
Income from discontinued operations before income taxes
|
|
|
8,506
|
|
|
3,564
|
|
|
—
|
|
|
Income tax expense
|
|
|
(3,249)
|
|
|
(1,354)
|
|
|
—
|
|
|
Net income from discontinued operations
|
|
$
|
5,257
|
|
|
2,210
|
|
|
—
|
|
(5) Sale of Appalachian Gathering Assets
On March 26, 2012, the Company closed the sale of a portion of its Marcellus Shale gathering system assets in West Virginia along with exclusive rights to gather the Company’s gas for a 20 year period within an area of dedication to a joint venture owned by
Table of Contents
ANTERO RESOURCES CORPORATION
Notes to Consolidated Financial Statements (Continued)
Years Ended December 31, 2013, 2014, and 2015
Crestwood Midstream Partners and Crestwood Holdings Partners LLC (together “Crestwood”). During the first seven years of the contract, the Company is committed to deliver minimum annual volumes into the gathering systems, with certain carryback and carryforward adjustments for overages or deficiencies.
Under the terms of the agreement, the Company earned additional proceeds of $40 million by meeting certain volume thresholds by December 31, 2014. The Company recognized the $40 million gain on the sale of assets in 2014. The amount was paid by Crestwood in 2015.
(6) Long‑Term Debt
Long‑term debt was follows at December 31, 2014 and 2015 (in thousands):
|
|
|
|
|
|
|
|
|
|
|
|
2014
|
|
2015
|
|
|
Antero:
|
|
|
|
|
|
|
|
|
Bank credit facility(a)
|
|
$
|
1,730,000
|
|
|
707,000
|
|
|
6.00% senior notes due 2020(c)
|
|
|
525,000
|
|
|
525,000
|
|
|
5.375% senior notes due 2021(d)
|
|
|
1,000,000
|
|
|
1,000,000
|
|
|
5.125% senior notes due 2022(e)
|
|
|
1,100,000
|
|
|
1,100,000
|
|
|
5.625% senior notes due 2023(f)
|
|
|
—
|
|
|
750,000
|
|
|
Net unamortized premium
|
|
|
7,550
|
|
|
6,513
|
|
|
Antero Midstream:
|
|
|
|
|
|
|
|
|
Bank credit facility(b)
|
|
|
—
|
|
|
620,000
|
|
|
|
|
$
|
4,362,550
|
|
|
4,708,513
|
|
(a) Senior Secured Revolving Credit Facility
Antero has a senior secured revolving bank credit facility (the “Credit Facility”) with a consortium of bank lenders. Borrowings under the Credit Facility are subject to borrowing base limitations based on the collateral value of Antero’s proved properties and commodity hedge positions and are subject to regular semiannual redeterminations. At December 31, 2015, the borrowing base was $4.5 billion and lender commitments were $4.0 billion. The next redetermination of the borrowing base is scheduled to occur in April 2016. The maturity date of the Credit Facility is May 5, 2019
The Credit Facility is ratably secured by mortgages on substantially all of Antero’s properties and guarantees from Antero’s restricted subsidiaries, as applicable. The Credit Facility contains certain covenants, including restrictions on indebtedness and dividends, and requirements with respect to working capital and interest coverage ratios. Interest is payable at a variable rate based on LIBOR or the prime rate, determined by Antero’s election at the time of borrowing. Antero was in compliance with all of the financial covenants under the Credit Facility as of December 31, 2014 and 2015.
As of December 31, 2015, Antero had an outstanding balance under the Credit Facility of $707 million, with a weighted average interest rate of 2.32%, and outstanding letters of credit of $702 million. As of December 31, 2014, Antero had an outstanding balance under the Credit Facility of $1.7 billion, with a weighted average interest rate of 2.06%, and outstanding letters of credit of approximately $387 million. Commitment fees on the unused portion of the Credit Facility are due quarterly at rates ranging from 0.375% to 0.50% of the unused portion based on utilization.
(b) Senior Secured Revolving Credit Facility – Antero Midstream
On November 10, 2014, Antero Midstream entered into a senior secured revolving bank credit facility (the “Midstream Facility”) with a consortium of bank lenders. At December 31, 2015, the maximum amount of the facility was $1.5 billion. The maturity date of the Midstream Facility is November 10, 2019.
The Midstream Facility is ratably secured by mortgages on substantially all of the properties of Antero Midstream and guarantees from its restricted subsidiaries, as applicable. The Midstream Facility contains certain covenants, including restrictions on indebtedness and certain distributions to owners and requirements with respect to leverage and interest coverage ratios. Interest is
Table of Contents
ANTERO RESOURCES CORPORATION
Notes to Consolidated Financial Statements (Continued)
Years Ended December 31, 2013, 2014, and 2015
payable at a variable rate based on LIBOR or the prime rate, determined by election at the time of borrowing. Antero Midstream was in compliance with all of the financial covenants under the Midstream Facility as of December 31, 2014 and 2015.
As of December 31, 2015, Antero Midstream had an outstanding balance under the Midstream Facility of $620 million, with a weighted average interest rate of 1.92%. As of December 31, 2014, Antero Midstream did not have a balance outstanding under the Midstream Facility. Commitment fees on the unused portion of the Midstream Facility are due quarterly at rates ranging from 0.25% to 0.375% of the unused facility based on utilization.
(c) 6.00% Senior Notes Due 2020
On November 19, 2012, Antero issued $300 million of 6.00% senior notes due December 1, 2020 (the “2020 notes”) at par. On February 4, 2013, Antero issued an additional $225 million of the 2020 notes at 103% of par. The 2020 notes are unsecured and effectively subordinated to the Credit Facility to the extent of the value of the collateral securing the Credit Facility. The 2020 notes rank pari passu to Antero’s other outstanding senior notes. The 2020 notes are guaranteed on a full and unconditional and joint and several senior unsecured basis by Antero’s wholly-owned subsidiaries and certain of its future restricted subsidiaries. Interest on the 2020 notes is payable on June 1 and December 1 of each year. Antero may redeem all or part of the 2020 notes at any time at redemption prices ranging from 104.50% currently to 100.00% on or after December 1, 2018. If Antero undergoes a change of control, the holders of the 2020 notes will have the right to require Antero to repurchase all or a portion of the notes at a price equal to 101% of the principal amount of the 2020 notes, plus accrued interest.
(d) 5.375% Senior Notes Due 2021
On November 5, 2013, Antero issued $1 billion of 5.375% senior notes due November 21, 2021 (the “2021 notes”) at par. The 2021 notes are unsecured and effectively subordinated to the Credit Facility to the extent of the value of the collateral securing the Credit Facility. The 2021 notes rank pari passu to Antero’s other outstanding senior notes. The 2021 notes are guaranteed on a full and unconditional and joint and several senior unsecured basis by Antero’s wholly-owned subsidiaries and certain of its future restricted subsidiaries. Interest on the 2021 notes is payable on May 1 and November 1 of each year. Antero may redeem all or part of the 2021 notes at any time on or after November 1, 2016 at redemption prices ranging from 104.031% on or after November 1, 2016 to 100.00% on or after November 1, 2019. In addition, on or before November 1, 2016, Antero may redeem up to 35% of the aggregate principal amount of the 2021 notes with the net cash proceeds of certain equity offerings, if certain conditions are met, at a redemption price of 105.375% of the principal amount of the 2021 notes, plus accrued interest. At any time prior to November 1, 2016, Antero may also redeem the 2021 notes, in whole or in part, at a price equal to 100% of the principal amount of the 2021 notes, plus a “make‑whole” premium and accrued interest. If Antero undergoes a change of control, the holders of the 2021 notes will have the right to require Antero to repurchase all or a portion of the notes at a price equal to 101% of the principal amount of the 2021 notes, plus accrued interest.
(e) 5.125% Senior Notes Due 2022
On May 6, 2014, Antero issued $600 million of 5.125% senior notes due December 1, 2022 (the “2022 notes”) at par. On September 18, 2014, Antero issued an additional $500 million of the 2022 notes at 100.5% of par. The 2022 notes are unsecured and effectively subordinated to the Credit Facility to the extent of the value of the collateral securing the Credit Facility. The 2022 notes rank pari passu to Antero’s other outstanding senior notes. The 2022 notes are guaranteed on a full and unconditional and joint and several senior unsecured basis by Antero’s wholly-owned subsidiaries and certain of its future restricted subsidiaries. Interest on the 2022 notes is payable on June 1 and December 1 of each year. Antero may redeem all or part of the 2022 notes at any time on or after June 1, 2017 at redemption prices ranging from 103.844% on or after June 1, 2017 to 100.00% on or after June 1, 2020. In addition, on or before June 1, 2017, Antero may redeem up to 35% of the aggregate principal amount of the 2022 notes with the net cash proceeds of certain equity offerings, if certain conditions are met, at a redemption price of 105.125% of the principal amount of the 2022 notes, plus accrued interest. At any time prior to June 1, 2017, Antero may also redeem the 2022 notes, in whole or in part, at a price equal to 100% of the principal amount of the 2022 notes plus a “make-whole” premium and accrued interest. If Antero undergoes a change of control, the holders of the 2022 notes will have the right to require Antero to repurchase all or a portion of the notes at a price equal to 101% of the principal amount of the 2022 notes, plus accrued interest.
Table of Contents
ANTERO RESOURCES CORPORATION
Notes to Consolidated Financial Statements (Continued)
Years Ended December 31, 2013, 2014, and 2015
(f) 5.625% Senior Notes Due 2023
On March 17, 2015, Antero issued $750 million of 5.625% senior notes due June 1, 2023 (the “2023 notes”) at par. The 2023 notes are unsecured and effectively subordinated to the Credit Facility to the extent of the value of the collateral securing the Credit Facility. The 2023 notes rank pari passu to Antero’s other outstanding senior notes. The 2023 notes are guaranteed on a full and unconditional and joint and several senior unsecured basis by Antero’s wholly-owned subsidiaries and certain of its future restricted subsidiaries. Interest on the 2023 notes is payable on June 1 and December 1 of each year. Antero may redeem all or part of the 2023 notes at any time on or after June 1, 2018 at redemption prices ranging from 104.219% on or after June 1, 2018 to 100.00% on or after June 1, 2021. In addition, on or before June 1, 2018, Antero may redeem up to 35% of the aggregate principal amount of the 2023 notes with the net cash proceeds of certain equity offerings, if certain conditions are met, at a redemption price of 105.625% of the principal amount of the 2023 notes, plus accrued interest. At any time prior to June 1, 2018, Antero may also redeem the 2023 notes, in whole or in part, at a price equal to 100% of the principal amount of the 2023 notes plus a “make-whole” premium and accrued interest. If Antero undergoes a change of control prior to June 1, 2016, it may redeem all, but not less than all, of the 2023 notes at a redemption price equal to 110% of the principal amount of the 2023 notes. If Antero undergoes a change of control, the holders of the 2023 notes will have the right to require Antero to repurchase all or a portion of the notes at a price equal to 101% of the principal amount of the 2023 notes, plus accrued interest.
(g) Treasury Management Facility
Antero has a stand‑alone revolving note with a lender under the Credit Facility which provides for up to $25 million of cash management obligations in order to facilitate Antero’s daily treasury management. Borrowings under the revolving note are secured by the collateral for the Credit Facility. Borrowings under the facility bear interest at the lender’s prime rate plus 1.0%. The note matures on May 1, 2016. At December 31, 2014 and 2015, there were no outstanding borrowings under this facility.
(7) Asset Retirement Obligations
The following is a reconciliation of the Company’s asset retirement obligations for the years ended December 31, 2014 and 2015 (in thousands).
|
|
|
|
|
|
|
|
|
|
|
|
2014
|
|
2015
|
|
|
Asset retirement obligations—beginning of year
|
|
$
|
11,859
|
|
$
|
16,614
|
|
|
Obligations incurred for wells drilled
|
|
|
3,484
|
|
|
9,213
|
|
|
Revisions to prior estimates
|
|
|
—
|
|
|
3,130
|
|
|
Accretion expense
|
|
|
1,271
|
|
|
1,655
|
|
|
Asset retirement obligations—end of year
|
|
$
|
16,614
|
|
$
|
30,612
|
|
Revisions to prior estimates in 2015 are primarily due to a decrease in the estimated economic lives of our wells as a result of the decrease in commodity prices during 2015. Asset retirement obligations are included in other liabilities on the consolidated balance sheets.
(8) Equity‑Based Compensation
Antero is authorized to grant up to 16,906,500 shares of common stock to employees and directors of the Company under the Antero Resources Corporation Long‑Term Incentive Plan (the “Plan”). The Plan allows equity‑based compensation awards to be granted in a variety of forms, including stock options, stock appreciation rights, restricted stock awards, restricted stock unit awards, dividend equivalent awards, and other types of awards. The terms and conditions of the awards granted are established by the Compensation Committee of Antero’s Board of Directors. A total of 9,377,755 shares were available for future grant under the Plan as of December 31, 2015.
Table of Contents
ANTERO RESOURCES CORPORATION
Notes to Consolidated Financial Statements (Continued)
Years Ended December 31, 2013, 2014, and 2015
In connection with the Antero Midstream IPO, Antero Midstream’s general partner adopted the Antero Midstream Partners LP Long-Term Incentive Plan (the “Midstream Plan”), pursuant to which non-employee directors of Antero Midstream’s general partner and certain officers, employees, and consultants of Antero Midstream’s general partner and its affiliates (which include Antero) are eligible to receive awards representing ownership interests in Antero Midstream. An aggregate of 10,000,000 common units may be delivered pursuant to awards under the Midstream Plan, subject to customary adjustments. A total of 7,947,771 common units are available for future grant under the Midstream Plan as of December 31, 2015.
The Company’s equity‑based compensation expense is as follows for the years ended December 31, 2013, 2014, and 2015 (in thousands):
|
|
|
|
|
|
|
|
|
|
|
|
|
|
|
Year ended December 31,
|
|
|
|
|
2013
|
|
2014
|
|
2015
|
|
|
Profits interests awards
|
|
$
|
364,957
|
|
|
83,615
|
|
|
37,620
|
|
|
Restricted stock awards
|
|
|
219
|
|
|
25,624
|
|
|
40,663
|
|
|
Stock options
|
|
|
104
|
|
|
501
|
|
|
2,155
|
|
|
Antero Midstream phantom and restricted unit awards
|
|
|
—
|
|
|
2,360
|
|
|
17,126
|
|
|
Common stock issued to directors in lieu of cash compensation
|
|
|
—
|
|
|
152
|
|
|
313
|
|
|
Total expense
|
|
$
|
365,280
|
|
|
112,252
|
|
|
97,877
|
|
Profits Interests Awards
In connection with its formation in October 2009, Antero Resources LLC issued profits interests to Antero Resources Employee Holdings LLC (“Employee Holdings”), which is owned solely by certain of the Company’s officers and employees. These profits interests provided for the participation in distributions upon liquidation events meeting certain requisite financial return thresholds. In turn, Employee Holdings issued membership interests to certain of the Company’s officers and employees. The Employee Holdings interests in Antero Resources LLC were exchanged for similar interests in Antero Investment in connection with the Company’s initial public offering on October 16, 2013.
The limited liability company agreement of Antero Investment provided a mechanism that demonstrated how the shares of the Company’s common stock held by Antero Investment would be allocated among its members, including Employee Holdings. As a result of the adoption of the Antero Investment Limited Liability Company Agreement, the satisfaction of all performance and service conditions relative to the profits interest awards held by Employee Holdings in Antero Investment became probable. Accordingly, the Company recognized approximately $486 million of equity-based compensation expense for the vested profits interests from the fourth quarter of 2013 through the fourth quarter of 2015. The profits interest awards were fully vested as of December 31, 2015, and no expense will be recognized for these awards in the future. Because consideration for the profits interest awards was deemed given by Antero Investment, the charge to equity-based compensation expense was accounted for as a capital contribution by Antero Investment to the Company and credited to additional paid-in capital. All available profits interest awards were made prior to the date of the IPO, and no additional profits interest awards were made since such date.
Restricted Stock and Restricted Stock Unit Awards
Restricted stock and restricted stock unit awards vest subject to the satisfaction of service requirements. Expense related to each restricted stock and restricted stock unit award is recognized on a straight-line basis over the requisite service period of the entire award, less awards expected to be forfeited. The grant date fair values of these awards are determined based on the closing price of
Table of Contents
ANTERO RESOURCES CORPORATION
Notes to Consolidated Financial Statements (Continued)
Years Ended December 31, 2013, 2014, and 2015
the Company’s common stock on the date of the grant. A summary of restricted stock and restricted stock unit awards activity during the year ended December 31, 2015 is as follows:
|
|
|
|
|
|
|
|
|
|
|
|
|
|
|
|
Weighted
average
|
|
Aggregate
|
|
|
|
|
Number of
shares
|
|
grant date
fair value
|
|
intrinsic value
(in thousands)
|
|
|
Total awarded and unvested—December 31, 2014
|
|
1,983,673
|
|
$
|
64.71
|
|
$
|
80,497
|
|
|
Granted
|
|
5,441,449
|
|
$
|
24.04
|
|
|
|
|
|
Vested
|
|
(377,630)
|
|
$
|
63.39
|
|
|
|
|
|
Forfeited
|
|
(518,033)
|
|
$
|
31.37
|
|
|
|
|
|
Total awarded and unvested—December 31, 2015
|
|
6,529,459
|
|
$
|
33.48
|
|
$
|
142,342
|
|
Intrinsic values are based on the closing price of the Company’s stock on the referenced dates. Unamortized expense of $177.6 million at December 31, 2015 is expected to be recognized over a weighted average period of approximately 2.7 years.
Stock Options
Stock options granted under the Plan vest over periods from one to four years and have a maximum contractual life of 10 years. Expense related to stock options is recognized on a straight‑line basis over the requisite service period of the entire award, less awards expected to be forfeited. Stock options are granted with an exercise price equal to or greater than the market price of the Company’s common stock on the date of grant. A summary of stock option activity for the year ended December 31, 2015 is as follows:
|
|
|
|
|
|
|
|
|
|
|
|
|
|
|
|
|
|
|
|
Weighted
|
|
|
|
|
|
|
|
|
Weighted
average
|
|
average
remaining
|
|
Intrinsic
|
|
|
|
|
Stock
options
|
|
exercise
price
|
|
contractual
life
|
|
value
(in thousands)
|
|
|
Outstanding at December 31, 2014
|
|
81,021
|
|
$
|
53.92
|
|
8.92
|
|
$
|
—
|
|
|
Granted
|
|
665,366
|
|
$
|
50.00
|
|
|
|
|
|
|
|
Exercised
|
|
—
|
|
|
—
|
|
|
|
|
|
|
|
Forfeited
|
|
(25,500)
|
|
$
|
50.00
|
|
|
|
|
|
|
|
Expired
|
|
—
|
|
|
—
|
|
|
|
|
|
|
|
Outstanding at December 31, 2015
|
|
720,887
|
|
$
|
50.44
|
|
9.14
|
|
$
|
—
|
|
|
Vested or expected to vest as of December 31, 2015
|
|
720,887
|
|
$
|
50.44
|
|
9.14
|
|
$
|
—
|
|
|
Exercisable at December 31, 2015
|
|
51,021
|
|
$
|
53.79
|
|
8.00
|
|
$
|
—
|
|
Intrinsic value is based on the exercise price of the options and the closing price of the Company’s stock on the referenced dates.
A Black‑Scholes option‑pricing model is used to determine the grant-date fair value of stock options. Expected volatility was derived from the volatility of the historical stock prices of a peer group of similar publicly traded companies’ stock prices. The risk‑free interest rate was determined using the implied yield available for zero‑coupon U.S. government issues with a remaining term approximating the expected life of the options. A dividend yield of zero was assumed.
The following table presents information regarding the weighted average fair value for options granted during the years ended December 31, 2013, 2014, and 2015 and the assumptions used to determine fair value.
|
|
|
|
|
|
|
|
|
|
|
|
|
|
|
|
|
|
Year ended December 31,
|
|
|
|
|
|
2013
|
|
|
2014
|
|
|
2015
|
|
|
|
Dividend yield
|
|
|
—
|
%
|
|
|
—
|
%
|
|
|
—
|
%
|
|
|
Volatility
|
|
|
35
|
%
|
|
|
40
|
%
|
|
|
40
|
%
|
|
|
Risk-free interest rate
|
|
|
1.48
|
%
|
|
|
1.75
|
%
|
|
|
1.66
|
%
|
|
|
Expected life (years)
|
|
|
6.17
|
|
|
|
5.50
|
|
|
|
6.25
|
|
|
|
Weighted average fair value of options granted
|
|
$
|
20.20
|
|
|
$
|
20.55
|
|
|
$
|
14.74
|
|
|
Table of Contents
ANTERO RESOURCES CORPORATION
Notes to Consolidated Financial Statements (Continued)
Years Ended December 31, 2013, 2014, and 2015
As of December 31, 2015, there was $8.3 million of unrecognized equity‑based compensation expense related to nonvested stock options. That expense is expected to be recognized over a weighted average period of approximately 3.2 years.
Antero Midstream Partners Phantom and Restricted Unit Awards
Restricted units and phantom units granted by Antero Midstream vest subject to the satisfaction of service requirements, upon the completion of which common units in Antero Midstream are delivered to the holder of the restricted units or phantom units. These restricted and phantom units are treated, for accounting purposes, as if Antero Midstream distributed the units to Antero. Antero recognizes compensation expense as the units are granted to employees, and a portion of the expense is allocated to Antero Midstream. Expense related to each restricted unit and phantom unit award is recognized on a straight-line basis over the requisite service period of the entire award, less awards expected to be forfeited. The grant date fair values of these awards are determined based on the closing price of Antero Midstream’s common units on the date of grant. A summary of restricted unit and phantom unit awards activity during the year ended December 31, 2015 is as follows:
|
|
|
|
|
|
|
|
|
|
|
|
|
|
Number of
units
|
|
Weighted
average
grant date
fair value
|
|
Aggregate
intrinsic value
(in thousands)
|
|
|
Total awarded and unvested—December 31, 2014
|
|
2,381,440
|
|
$
|
29.00
|
|
$
|
65,490
|
|
|
Granted
|
|
12,057
|
|
$
|
24.88
|
|
|
|
|
|
Vested
|
|
(595,595)
|
|
$
|
29.00
|
|
|
|
|
|
Forfeited
|
|
(130,070)
|
|
$
|
29.00
|
|
|
|
|
|
Total awarded and unvested—December 31, 2015
|
|
1,667,832
|
|
$
|
28.97
|
|
$
|
38,060
|
|
Intrinsic values are based on the closing price of Antero Midstream’s common units on the referenced dates. Unamortized expense of $46.1 million at December 31, 2015 is expected to be recognized over a weighted average period of approximately 2.9 years.
(9) Financial Instruments
The carrying values of accounts receivable and accounts payable at December 31, 2014 and 2015 approximated market value because of their short‑term nature. The carrying values of the amounts outstanding under the Credit Facility and Midstream Facility at December 31, 2014 and 2015 approximated fair value because the variable interest rates are reflective of current market conditions.
Based on Level 2 market data inputs, the fair value of the Company’s senior notes was approximately $2.5 billion at December 31, 2014 and $2.6 billion at December 31, 2015.
See note 10 for information regarding the fair value of derivative financial instruments.
(10) Derivative Instruments
(a) Commodity Derivatives
The Company periodically enters into natural gas, NGLs, and oil derivative contracts with counterparties to hedge the price risk associated with a portion of its production. These derivatives are not held for trading purposes. To the extent that changes occur in the market prices of natural gas, NGLs, and oil, the Company is exposed to market risk on these open contracts. This market risk exposure is generally offset by the change in market prices of natural gas, NGLs, and oil recognized upon the ultimate sale of The Company’s production.
During the years ended December 31, 2013, 2014, and 2015, the Company was party to various natural gas, NGLs, and oil fixed price swap contracts. When actual commodity prices exceed the fixed price provided by the swap contracts, the Company pays the excess to the counterparty. When actual commodity prices are below the contractually provided fixed price, the Company receives the difference from the counterparty. In addition, the Company has entered into basis swap contracts in order to hedge the difference
Table of Contents
ANTERO RESOURCES CORPORATION
Notes to Consolidated Financial Statements (Continued)
Years Ended December 31, 2013, 2014, and 2015
between the New York Mercantile Exchange (“NYMEX”) index price and a local index price. The Company’s derivative swap contracts have not been designated as hedges for accounting purposes; therefore, all gains and losses are recognized in the Company’s statements of operations.
As of December 31, 2015, the Company’s fixed price natural gas and NGLs swap positions from January 1, 2016 through December 31, 2022 were as follows (abbreviations in the table refer to the index to which the swap position is tied, as follows: TCO=Columbia Gas Transmission; NYMEX=Henry Hub; CGTLA=Columbia Gas Louisiana Onshore; CCG=Chicago City Gate; Mont Belvieu-TET=Mont Belvieu Propane):
Table of Contents
ANTERO RESOURCES CORPORATION
Notes to Consolidated Financial Statements (Continued)
Years Ended December 31, 2013, 2014, and 2015
|
|
|
|
|
|
|
|
|
|
|
|
|
Natural gas
MMbtu/day
|
|
Propane
Bbls/day
|
|
Weighted
average index
price
|
|
|
Three months ending March 31, 2016:
|
|
|
|
|
|
|
|
|
|
TCO ($/MMBtu)
|
|
60,000
|
|
—
|
|
$
|
5.07
|
|
|
Dominion South ($/MMBtu)
|
|
272,500
|
|
—
|
|
$
|
5.54
|
|
|
NYMEX ($/MMBtu)
|
|
1,110,000
|
|
—
|
|
$
|
3.58
|
|
|
CGTLA ($/MMBtu)
|
|
170,000
|
|
—
|
|
$
|
4.21
|
|
|
Mont Belvieu-TET ($/Gallon)
|
|
—
|
|
30,000
|
|
$
|
0.58
|
|
|
Total
|
|
1,612,500
|
|
30,000
|
|
|
|
|
|
Three months ending June 30, 2016:
|
|
|
|
|
|
|
|
|
|
TCO ($/MMBtu)
|
|
60,000
|
|
—
|
|
$
|
4.77
|
|
|
Dominion South ($/MMBtu)
|
|
272,500
|
|
—
|
|
$
|
5.17
|
|
|
NYMEX ($/MMBtu)
|
|
1,110,000
|
|
—
|
|
$
|
3.38
|
|
|
CGTLA ($/MMBtu)
|
|
170,000
|
|
—
|
|
$
|
3.94
|
|
|
Mont Belvieu-TET ($/Gallon)
|
|
—
|
|
30,000
|
|
$
|
0.57
|
|
|
Total
|
|
1,612,500
|
|
30,000
|
|
|
|
|
|
Three months ending September 30, 2016:
|
|
|
|
|
|
|
|
|
|
TCO ($/MMBtu)
|
|
60,000
|
|
—
|
|
$
|
4.81
|
|
|
Dominion South ($/MMBtu)
|
|
272,500
|
|
—
|
|
$
|
5.24
|
|
|
NYMEX ($/MMBtu)
|
|
1,110,000
|
|
—
|
|
$
|
3.44
|
|
|
CGTLA ($/MMBtu)
|
|
170,000
|
|
—
|
|
$
|
4.03
|
|
|
Mont Belvieu-TET ($/Gallon)
|
|
—
|
|
30,000
|
|
$
|
0.58
|
|
|
Total
|
|
1,612,500
|
|
30,000
|
|
|
|
|
|
Three months ending December 31, 2016:
|
|
|
|
|
|
|
|
|
|
TCO ($/MMBtu)
|
|
60,000
|
|
—
|
|
$
|
5.01
|
|
|
Dominion South ($/MMBtu)
|
|
272,500
|
|
—
|
|
$
|
5.47
|
|
|
NYMEX ($/MMBtu)
|
|
1,110,000
|
|
—
|
|
$
|
3.57
|
|
|
CGTLA ($/MMBtu)
|
|
170,000
|
|
—
|
|
$
|
4.20
|
|
|
Mont Belvieu-TET ($/Gallon)
|
|
—
|
|
30,000
|
|
$
|
0.61
|
|
|
Total
|
|
1,612,500
|
|
30,000
|
|
|
|
|
|
Year ending December 31, 2017:
|
|
|
|
|
|
|
|
|
|
NYMEX ($/MMBtu)
|
|
1,370,000
|
|
—
|
|
$
|
3.39
|
|
|
CGTLA ($/MMBtu)
|
|
420,000
|
|
—
|
|
$
|
4.27
|
|
|
CCG ($/MMBtu)
|
|
70,000
|
|
—
|
|
$
|
4.57
|
|
|
Mont Belvieu-TET ($/Gallon)
|
|
—
|
|
35,500
|
|
$
|
0.43
|
|
|
Total
|
|
1,860,000
|
|
35,500
|
|
|
|
|
|
Year ending December 31, 2018:
|
|
|
|
|
|
|
|
|
|
NYMEX ($/MMBtu)
|
|
2,002,500
|
|
—
|
|
$
|
3.91
|
|
|
Mont Belvieu-TET ($/Gallon)
|
|
—
|
|
2,000
|
|
$
|
0.65
|
|
|
Total
|
|
2,002,500
|
|
2,000
|
|
|
|
|
|
Year ending December 31, 2019:
|
|
|
|
|
|
|
|
|
|
NYMEX ($/MMBtu)
|
|
1,960,000
|
|
|
|
$
|
3.87
|
|
|
Year ending December 31, 2020:
|
|
|
|
|
|
|
|
|
|
NYMEX ($/MMBtu)
|
|
1,287,500
|
|
|
|
$
|
3.72
|
|
|
Year ending December 31, 2021:
|
|
|
|
|
|
|
|
|
|
NYMEX ($/MMBtu)
|
|
480,000
|
|
|
|
$
|
3.48
|
|
|
Year ending December 31, 2022:
|
|
|
|
|
|
|
|
|
|
NYMEX ($/MMBtu)
|
|
10,000
|
|
|
|
$
|
3.30
|
|
As of December 31, 2015, the Company’s natural gas basis swap positions, which settle on the pricing index to basis
Table of Contents
ANTERO RESOURCES CORPORATION
Notes to Consolidated Financial Statements (Continued)
Years Ended December 31, 2013, 2014, and 2015
differential of TCO to the NYMEX Henry Hub natural gas price, are as follows:
|
|
|
|
|
|
|
|
|
|
|
Natural gas
MMbtu/day
|
|
Hedged
Differential
|
|
|
|
|
|
|
|
|
|
|
Year ending December 31, 2016:
|
|
290,000
|
|
$
|
(0.42)
|
|
|
|
|
|
|
|
|
|
|
Year ending December 31, 2017:
|
|
125,000
|
|
$
|
(0.49)
|
|
As of December 31, 2015, the Company’s natural gas basis swap positions, which settle on the pricing index to basis differential of NYMEX Henry Hub to the TCO natural gas price, are as follows:
|
|
|
|
|
|
|
|
|
|
|
Natural gas
MMbtu/day
|
|
Hedged
Differential
|
|
|
|
|
|
|
|
|
|
|
Year ending December 31, 2016:
|
|
170,000
|
|
$
|
0.26
|
|
|
|
|
|
|
|
|
|
|
Year ending December 31, 2017:
|
|
125,000
|
|
$
|
0.30
|
|
(b) Summary
The following is a summary of the fair values of the Company’s derivative instruments and where such values are recorded in the consolidated balance sheets as of December 31, 2014 and 2015. None of the Company’s derivative instruments are designated as hedges for accounting purposes.
|
|
|
|
|
|
|
|
|
|
|
|
|
|
|
|
December 31, 2014
|
|
December 31, 2015
|
|
|
|
|
Balance sheet
location
|
|
Fair value
|
|
Balance sheet
location
|
|
Fair value
|
|
|
|
|
|
|
(In thousands)
|
|
|
|
(In thousands)
|
|
|
Asset derivatives not designated as hedges for accounting purposes:
|
|
|
|
|
|
|
|
|
|
|
|
|
Commodity contracts
|
|
Current assets
|
|
$
|
692,554
|
|
Current assets
|
|
$
|
1,009,030
|
|
|
Commodity contracts
|
|
Long-term assets
|
|
|
899,997
|
|
Long-term assets
|
|
|
2,108,450
|
|
|
|
|
|
|
|
|
|
|
|
|
|
|
|
Total asset derivatives
|
|
|
|
|
1,592,551
|
|
|
|
|
3,117,480
|
|
|
|
|
|
|
|
|
|
|
|
|
|
|
|
Total liability derivatives
|
|
|
|
|
—
|
|
|
|
|
—
|
|
|
|
|
|
|
|
|
|
|
|
|
|
|
|
Net derivatives
|
|
|
|
$
|
1,592,551
|
|
|
|
$
|
3,117,480
|
|
The following table presents the gross amounts of recognized derivative assets and liabilities, the amounts offset under master netting arrangements with counterparties, and the resulting net amounts presented in the consolidated balance sheets as of the dates presented, all at fair value (in thousands):
|
|
|
|
|
|
|
|
|
|
|
|
|
|
|
|
|
|
|
|
|
|
|
|
December 31, 2014
|
|
December 31, 2015
|
|
|
|
|
Gross
amounts on
balance sheet
|
|
Gross amounts
offset on
balance sheet
|
|
Net amounts
of assets on
balance sheet
|
|
Gross
amounts on
balance sheet
|
|
Gross amounts
offset on
balance sheet
|
|
Net amounts
of assets on
balance sheet
|
|
|
Commodity derivative assets
|
|
$
|
1,621,665
|
|
|
(29,114)
|
|
|
1,592,551
|
|
$
|
3,163,639
|
|
|
(46,159)
|
|
|
3,117,480
|
|
|
Commodity derivative liabilities
|
|
$
|
—
|
|
|
—
|
|
|
—
|
|
$
|
—
|
|
|
—
|
|
|
—
|
|
Table of Contents
ANTERO RESOURCES CORPORATION
Notes to Consolidated Financial Statements (Continued)
Years Ended December 31, 2013, 2014, and 2015
The following is a summary of derivative fair value gains and where such values are recorded in the consolidated statements of operations for the years ended December 31, 2013, 2014, and 2015 (in thousands):
|
|
|
|
|
|
|
|
|
|
|
|
|
|
|
|
|
Statement of
operations
|
|
Year ended December 31,
|
|
|
|
|
location
|
|
2013
|
|
2014
|
|
2015
|
|
|
Commodity derivative fair value gains
|
|
Revenue
|
|
$
|
491,689
|
|
|
868,201
|
|
|
2,381,501
|
|
The fair value of commodity derivative instruments was determined using Level 2 inputs.
(11)Contract Termination and Rig Stacking
During the year ended December 31, 2015, the Company incurred $38.5 million of costs for the buy-back and termination of a firm sales contract priced at an unfavorable pricing index and the delay or cancelation of drilling contracts with third-party contractors.
(12) Income Taxes
For the years ended December 31, 2013, 2014, and 2015, income tax expense from continuing operations consisted of the following (in thousands):
|
|
|
|
|
|
|
|
|
|
|
|
|
|
|
Year ended December 31,
|
|
|
|
|
2013
|
|
2014
|
|
2015
|
|
|
Current income tax benefit
|
|
$
|
(4,000)
|
|
|
—
|
|
|
—
|
|
|
Deferred income tax expense
|
|
|
190,210
|
|
|
445,672
|
|
|
575,890
|
|
|
Total income tax expense from continuing operations
|
|
$
|
186,210
|
|
|
445,672
|
|
|
575,890
|
|
Income tax expense from continuing operations differs from the amount that would be computed by applying the U.S. statutory federal income tax rate of 35% to income from continuing operations for the years ended December 31, 2013, 2014, and 2015 as a result of the following (in thousands):
|
|
|
|
|
|
|
|
|
|
|
|
|
|
|
Year ended December 31,
|
|
|
|
|
2013
|
|
2014
|
|
2015
|
|
|
Federal income tax expense
|
|
$
|
56,708
|
|
|
391,754
|
|
|
544,560
|
|
|
State income tax expense, net of federal benefit
|
|
|
21,429
|
|
|
25,545
|
|
|
26,983
|
|
|
Nondeductible equity-based compensation
|
|
|
127,736
|
|
|
29,141
|
|
|
16,441
|
|
|
Noncontrolling interest in Antero Midstream Partners LP
|
|
|
—
|
|
|
(787)
|
|
|
(13,521)
|
|
|
Change in valuation allowance
|
|
|
(20,919)
|
|
|
(120)
|
|
|
570
|
|
|
Other
|
|
|
1,256
|
|
|
139
|
|
|
857
|
|
|
Total income tax expense from continuing operations
|
|
$
|
186,210
|
|
|
445,672
|
|
|
575,890
|
|
For the years ended December 31, 2013, 2014, and 2015, income tax expense was allocated to continuing and discontinued operations as follows (in thousands):
|
|
|
|
|
|
|
|
|
|
|
|
|
|
|
Year ended December 31,
|
|
|
|
|
2013
|
|
2014
|
|
2015
|
|
|
Continuing operations
|
|
$
|
186,210
|
|
|
445,672
|
|
|
575,890
|
|
|
Discontinued operations and sale of discontinued operations
|
|
|
3,249
|
|
|
1,354
|
|
|
—
|
|
|
Total income tax expense
|
|
$
|
189,459
|
|
|
447,026
|
|
|
575,890
|
|
Table of Contents
ANTERO RESOURCES CORPORATION
Notes to Consolidated Financial Statements (Continued)
Years Ended December 31, 2013, 2014, and 2015
Deferred income taxes reflect the impact of temporary differences between assets and liabilities for financial reporting purposes and such amounts as measured by tax laws. The tax effect of the temporary differences giving rise to net deferred tax assets and liabilities at December 31, 2014 and 2015 is as follows (in thousands):
|
|
|
|
|
|
|
|
|
|
|
|
2014
|
|
2015
|
|
|
Deferred tax assets:
|
|
|
|
|
|
|
|
|
Net operating loss carryforwards
|
|
$
|
431,681
|
|
|
521,617
|
|
|
Minimum tax credit carryforward
|
|
|
11,000
|
|
|
11,000
|
|
|
Equity-based compensation
|
|
|
10,032
|
|
|
16,130
|
|
|
Other
|
|
|
12,785
|
|
|
18,633
|
|
|
Total deferred tax assets
|
|
|
465,498
|
|
|
567,380
|
|
|
Valuation allowance
|
|
|
(26,639)
|
|
|
(27,209)
|
|
|
Net deferred tax assets
|
|
|
438,859
|
|
|
540,171
|
|
|
Deferred tax liabilities:
|
|
|
|
|
|
|
|
|
Unrealized gains on derivative instruments
|
|
|
601,859
|
|
|
1,167,983
|
|
|
Oil and gas properties
|
|
|
600,050
|
|
|
708,664
|
|
|
Investment in Antero Midstream Partners LP
|
|
|
31,746
|
|
|
34,210
|
|
|
Total deferred tax liabilities
|
|
|
1,233,655
|
|
|
1,910,857
|
|
|
Net deferred tax liabilities
|
|
$
|
(794,796)
|
|
|
(1,370,686)
|
|
In assessing the realizability of deferred tax assets, management considers whether some portion or all of the deferred tax assets will be realized based on a more-likely-than-not standard of judgment. The ultimate realization of deferred tax assets is dependent upon the generation of future taxable income during the periods in which the Company’s temporary differences become deductible. Management considers the scheduled reversal of deferred tax liabilities, projected future taxable income, and tax planning strategies in making this assessment. Based upon the projections of future taxable income over the periods in which the deferred tax assets are deductible, management believes that the Company will not realize the benefits of certain of these deductible differences and has recorded a valuation allowance of approximately $27 million at December 31, 2014 and 2015 related to NOL carryforwards primarily attributable to states where the Company no longer operates. The amount of the deferred tax asset considered realizable could be reduced in the near term if estimates of future taxable income during the carryforward period are revised.
The calculation of the Company’s tax liabilities involves uncertainties in the application of complex tax laws and regulations. The Company gives financial statement recognition to those tax positions that it believes are more‑likely-than‑not to be sustained upon examination by the Internal Revenue Service or state revenue authorities. The financial statements include unrecognized benefits at December 31, 2015 of $11 million that, if recognized, would result in a reduction of noncurrent income taxes payable (included in other long‑term liabilities) and an increase in noncurrent deferred tax liabilities. No impact to the Company’s 2015 effective tax rate would result. As of December 31, 2015, interest of $1.6 million has been accrued on unrecognized tax benefits. A reconciliation of the beginning and ending amounts of unrecognized tax benefits is as follows:
|
|
|
|
|
|
|
|
|
|
|
|
|
|
|
2013
|
|
2014
|
|
2015
|
|
|
Balance at beginning of year
|
|
$
|
15,000
|
|
|
11,000
|
|
|
11,000
|
|
|
Revised estimate of unrecognized tax position
|
|
|
(4,000)
|
|
|
—
|
|
|
—
|
|
|
Balance at end of year
|
|
$
|
11,000
|
|
|
11,000
|
|
|
11,000
|
|
As of December 31, 2015, the Company’s corporate subsidiaries have U.S. Federal and state net operating loss carryforwards (NOLs) of $1.4 billion and $1.2 billion, respectively, which expire at various dates from 2024 to 2035.
The tax years 2012 through 2014 remain open to examination by the U.S. Internal Revenue Service. The Company and its subsidiaries file tax returns with various state taxing authorities; these returns remain open to examination for tax years 2011 through 2015. During 2015, the State of West Virginia completed its examination of the tax returns of Antero Resources Corporation for its tax years 2011 through 2013. There were no material adjustments to our provision for income taxes as a result of the examination.
Table of Contents
ANTERO RESOURCES CORPORATION
Notes to Consolidated Financial Statements (Continued)
Years Ended December 31, 2013, 2014, and 2015
(13) Commitments
The following is a schedule of future minimum payments for firm transportation, drilling rig, hydraulic fracturing, processing, gathering and compression, and office and equipment agreements, as well as leases that have remaining lease terms in excess of one year as of December 31, 2015 (in millions).
|
|
|
|
|
|
|
|
|
|
|
|
|
|
|
|
|
|
|
|
|
Firm
transportation
|
|
Processing,
gathering and
compression
|
|
Drilling rigs
and frac
services
|
|
Office and equipment
|
|
|
|
|
|
|
(a)
|
|
(b)
|
|
(c)
|
|
(d)
|
|
Total
|
|
|
Year ending December 31:
|
|
|
|
|
|
|
|
|
|
|
|
|
|
|
|
|
|
2016
|
|
$
|
522
|
|
|
320
|
|
|
171
|
|
|
13
|
|
|
1,026
|
|
|
2017
|
|
|
729
|
|
|
344
|
|
|
104
|
|
|
14
|
|
|
1,191
|
|
|
2018
|
|
|
900
|
|
|
242
|
|
|
4
|
|
|
24
|
|
|
1,170
|
|
|
2019
|
|
|
1,060
|
|
|
186
|
|
|
—
|
|
|
22
|
|
|
1,268
|
|
|
2020
|
|
|
1,079
|
|
|
186
|
|
|
—
|
|
|
20
|
|
|
1,285
|
|
|
Thereafter
|
|
|
11,004
|
|
|
861
|
|
|
—
|
|
|
171
|
|
|
12,036
|
|
|
Total
|
|
$
|
15,294
|
|
|
2,139
|
|
|
279
|
|
|
264
|
|
|
17,976
|
|
(a) Firm Transportation
The Company has entered into firm transportation agreements with various pipelines in order to facilitate the delivery of its production to market. These contracts commit the Company to transport minimum daily natural gas or NGLs volumes at negotiated rates, or pay for any deficiencies at specified reservation fee rates. The amounts in this table represent the Company’s minimum daily volumes at the reservation fee rate. The values in the table represent the gross amounts that the Company is committed to pay; however, the Company will record in the consolidated financial statements its proportionate share of costs based on its working interest.
(b) Processing, Gathering, and Compression Service Commitments
The Company has entered into various long‑term gas processing agreements for certain of its production that will allow it to realize the value of its NGLs. The minimum payment obligations under the agreements are presented in the table.
The Company has various compressor service agreements with third parties that provide for payments based on volumes compressed and have minimum payment obligations which are presented in the table.
The values in the table represent the gross amounts that the Company is committed to pay; however, the Company will record in the consolidated financial statements its proportionate share of costs based on its working interest.
(c) Drilling Rig Service Commitments
The Company has obligations under agreements with service providers to procure drilling rigs and hydraulic fracturing services. The values in the table represent the gross amounts that the Company is committed to pay; however, the Company will record in the consolidated financial statements its proportionate share of costs based on its working interest.
(d) Office and Equipment Leases
The Company leases various office space and equipment, as well as field equipment, under operating lease arrangements. Rental expense under operating leases was $1.8 million, $10.2 million, and $9.0 million for the years ended December 31, 2013, 2014, and 2015, respectively.
Table of Contents
ANTERO RESOURCES CORPORATION
Notes to Consolidated Financial Statements (Continued)
Years Ended December 31, 2013, 2014, and 2015
(14) Contingencies
The Company is the subject of two nearly identical lawsuits brought by South Jersey Gas Company and South Jersey Resources Group, LLC (collectively “SJGC”) filed on February 4, 2015 in the Superior Court of New Jersey. The lawsuits have since been consolidated into one case. SJGC are purchasers of some of the Company’s natural gas production under contracts entered into in 2011. Deliveries under the contracts began in October 2011 and the delivery obligation continues through October 2019. SJGC allege that the index prices specified in the contracts, and the index prices at which SJGC paid for deliveries from 2011 through September 2014, are no longer appropriate under the contracts because a market disruption event (as defined by the contract) has occurred and, as a result, a new index price is to be determined by the parties. The lawsuit seeks a reformation of the contracts, compensatory and punitive damages to be determined at trial, and costs and expenses of the actions. Beginning in October 2014, SJGC began paying the Company under indexes unilaterally selected by SJGC and not specified in the contract. The Company contends that no market disruption event has occurred and that SJGC has breached the contracts by failing to pay the Company based on the express price terms of the contracts. The Company further contends that jurisdiction and venue are improper in New Jersey. On March 30, 2015, the Company filed suit against SJGC in United States District Court in Colorado seeking relief for breach of contract, damages in the amounts that SJGC has short paid and continues to short pay, as well as costs of the suit. Through December 31, 2015, the Company estimates that it is owed approximately $39 million more than SJGC has paid using the indexes unilaterally selected by them.
The Company is party to various other legal proceedings and claims in the ordinary course of its business. The Company believes that certain of these matters will be covered by insurance and that the outcome of other matters will not have a material adverse effect on the Company’s consolidated financial position, results of operations, or cash flows.
(15) Segment Information
See note 2(r) for a description of the Company’s determination of its reportable segments for 2015. Marketing of excess firm transportation capacity began in the second quarter of 2014, and was subsequently determined to be a new reportable segment. Revenues from gathering and compression and water handling and treatment operations are primarily derived from intersegment transactions for services provided to the Company’s exploration and production operations. Marketing revenues are primarily derived from activities to purchase and sell third-party natural gas and NGLs and to market excess firm transportation capacity to third parties.
Operating segments are evaluated based on their contribution to consolidated results, which is determined by the respective operating income of each segment. General and administrative expenses are allocated to the gathering and compression and water handling and treatment segments based on estimates of labor and overhead expenditures on those activities. General and administrative expenses related to the marketing segment are not allocated because they are immaterial. Other income, income taxes, and interest expense are primarily managed on a consolidated basis. Intersegment sales are transacted at prices which approximate
Table of Contents
ANTERO RESOURCES CORPORATION
Notes to Consolidated Financial Statements (Continued)
Years Ended December 31, 2013, 2014, and 2015
market. Accounting policies for each segment are the same as the Company’s accounting policies described in note 2 to the consolidated financial statements.
The operating results and assets of the Company’s reportable segments were as follows for the years ended December 31, 2013, 2014, and 2015 (in thousands):
|
|
|
|
|
|
|
|
|
|
|
|
|
|
|
|
|
Exploration
and
production
|
|
Gathering and
compression
|
|
Water
handling and
treatment
|
|
Elimination of
intersegment
transactions
|
|
Consolidated
total
|
|
|
Year ended December 31, 2013:
|
|
|
|
|
|
|
|
|
|
|
|
|
|
Sales and revenues:
|
|
|
|
|
|
|
|
|
|
|
|
|
|
Third-party
|
|
$
|
1,313,134
|
|
—
|
|
—
|
|
—
|
|
1,313,134
|
|
|
Intersegment
|
|
|
—
|
|
22,363
|
|
35,871
|
|
(58,234)
|
|
—
|
|
|
Total
|
|
$
|
1,313,134
|
|
22,363
|
|
35,871
|
|
(58,234)
|
|
1,313,134
|
|
|
|
|
|
|
|
|
|
|
|
|
|
|
|
|
Operating expenses:
|
|
|
|
|
|
|
|
|
|
|
|
|
|
Lease operating
|
|
$
|
9,439
|
|
—
|
|
3,843
|
|
(3,843)
|
|
9,439
|
|
|
Gathering, compression, processing, and transportation
|
|
|
238,712
|
|
2,079
|
|
—
|
|
(22,363)
|
|
218,428
|
|
|
Depletion, depreciation, and amortization
|
|
|
219,757
|
|
11,346
|
|
2,773
|
|
—
|
|
233,876
|
|
|
General and administrative expense
|
|
|
391,373
|
|
23,124
|
|
10,941
|
|
—
|
|
425,438
|
|
|
Other operating expenses
|
|
|
82,787
|
|
—
|
|
1,959
|
|
—
|
|
84,746
|
|
|
Total
|
|
|
942,068
|
|
36,549
|
|
19,516
|
|
(26,206)
|
|
971,927
|
|
|
Operating income (loss)
|
|
$
|
371,066
|
|
(14,186)
|
|
16,355
|
|
(32,028)
|
|
341,207
|
|
|
Segment assets
|
|
$
|
5,859,933
|
|
561,855
|
|
230,247
|
|
(38,454)
|
|
6,613,581
|
|
|
Capital expenditures for segment assets
|
|
$
|
2,110,358
|
|
389,453
|
|
203,790
|
|
(32,028)
|
|
2,671,573
|
|
|
|
|
|
|
|
|
|
|
|
|
|
|
|
|
|
|
|
|
Exploration
and
production
|
|
Gathering and
compression
|
|
Water
handling and
treatment
|
|
Marketing
|
|
Elimination of
intersegment
transactions
|
|
Consolidated
total
|
|
|
Year ended December 31, 2014:
|
|
|
|
|
|
|
|
|
|
|
|
|
|
|
|
Sales and revenues:
|
|
|
|
|
|
|
|
|
|
|
|
|
|
|
|
Third-party
|
|
$
|
2,644,953
|
|
6,810
|
|
15,265
|
|
53,604
|
|
—
|
|
2,720,632
|
|
|
Intersegment
|
|
|
195
|
|
88,936
|
|
156,660
|
|
—
|
|
(245,791)
|
|
—
|
|
|
Total
|
|
$
|
2,645,148
|
|
95,746
|
|
171,925
|
|
53,604
|
|
(245,791)
|
|
2,720,632
|
|
|
|
|
|
|
|
|
|
|
|
|
|
|
|
|
|
|
Operating expenses:
|
|
|
|
|
|
|
|
|
|
|
|
|
|
|
|
Lease operating
|
|
$
|
28,041
|
|
—
|
|
34,737
|
|
—
|
|
(33,437)
|
|
29,341
|
|
|
Gathering, compression, processing, and transportation
|
|
|
536,879
|
|
13,497
|
|
—
|
|
—
|
|
(88,963)
|
|
461,413
|
|
|
Depletion, depreciation, and amortization
|
|
|
424,684
|
|
36,972
|
|
16,240
|
|
—
|
|
—
|
|
477,896
|
|
|
General and administrative expense
|
|
|
186,335
|
|
22,035
|
|
8,331
|
|
—
|
|
(168)
|
|
216,533
|
|
|
Other operating expenses
|
|
|
128,419
|
|
1,973
|
|
1,888
|
|
103,435
|
|
—
|
|
235,715
|
|
|
Total
|
|
|
1,304,358
|
|
74,477
|
|
61,196
|
|
103,435
|
|
(122,568)
|
|
1,420,898
|
|
|
Operating income (loss)
|
|
$
|
1,340,790
|
|
21,269
|
|
110,729
|
|
(49,831)
|
|
(123,223)
|
|
1,299,734
|
|
|
Segment assets
|
|
$
|
9,920,331
|
|
1,411,470
|
|
422,885
|
|
10,456
|
|
(191,647)
|
|
11,573,495
|
|
|
Capital expenditures for segment assets
|
|
$
|
3,455,079
|
|
558,037
|
|
196,675
|
|
—
|
|
(123,223)
|
|
4,086,568
|
|
Table of Contents
ANTERO RESOURCES CORPORATION
Notes to Consolidated Financial Statements (Continued)
Years Ended December 31, 2013, 2014, and 2015
|
|
|
|
|
|
|
|
|
|
|
|
|
|
|
|
|
|
|
Exploration
and
production
|
|
Gathering and
compression
|
|
Water
handling and
treatment
|
|
Marketing
|
|
Elimination of
intersegment
transactions
|
|
Consolidated
total
|
|
|
Year ended December 31, 2015:
|
|
|
|
|
|
|
|
|
|
|
|
|
|
|
|
Sales and revenues:
|
|
|
|
|
|
|
|
|
|
|
|
|
|
|
|
Third-party
|
|
$
|
3,756,629
|
|
12,353
|
|
9,647
|
|
176,229
|
|
—
|
|
3,954,858
|
|
|
Intersegment
|
|
|
4,795
|
|
218,239
|
|
147,085
|
|
—
|
|
(370,119)
|
|
—
|
|
|
Total
|
|
$
|
3,761,424
|
|
230,592
|
|
156,732
|
|
176,229
|
|
(370,119)
|
|
3,954,858
|
|
|
|
|
|
|
|
|
|
|
|
|
|
|
|
|
|
|
Operating expenses:
|
|
|
|
|
|
|
|
|
|
|
|
|
|
|
|
Lease operating
|
|
$
|
35,552
|
|
—
|
|
49,859
|
|
—
|
|
(49,400)
|
|
36,011
|
|
|
Gathering, compression, processing, and transportation
|
|
|
852,573
|
|
25,305
|
|
—
|
|
—
|
|
(218,517)
|
|
659,361
|
|
|
Depletion, depreciation, and amortization
|
|
|
622,379
|
|
61,552
|
|
25,832
|
|
—
|
|
—
|
|
709,763
|
|
|
General and administrative expense
|
|
|
183,675
|
|
40,448
|
|
10,758
|
|
—
|
|
(1,184)
|
|
233,697
|
|
|
Other operating expenses
|
|
|
222,990
|
|
3,811
|
|
3,210
|
|
299,062
|
|
(3,333)
|
|
525,740
|
|
|
Total
|
|
|
1,917,169
|
|
131,116
|
|
89,659
|
|
299,062
|
|
(272,434)
|
|
2,164,572
|
|
|
Operating income (loss)
|
|
$
|
1,844,255
|
|
99,476
|
|
67,073
|
|
(122,833)
|
|
(97,685)
|
|
1,790,286
|
|
|
Segment assets
|
|
$
|
12,466,249
|
|
1,470,691
|
|
525,004
|
|
16,123
|
|
(322,843)
|
|
14,155,224
|
|
|
Capital expenditures for segment assets
|
|
$
|
1,954,256
|
|
360,287
|
|
131,051
|
|
—
|
|
(97,685)
|
|
2,347,909
|
|
(16) Subsidiary Guarantors
Antero’s wholly-owned subsidiaries each have fully and unconditionally guaranteed Antero’s senior notes. Antero Midstream and its subsidiaries have been designated unrestricted subsidiaries under the Credit Facility and the indentures governing Antero’s senior notes, and do not guarantee any of Antero’s obligations (see note 4). In the event a subsidiary guarantor is sold or disposed of (whether by merger, consolidation, the sale of a sufficient amount of its capital stock so that it no longer qualifies as a “Subsidiary” of the Company (as defined in the indentures governing the notes) or the sale of all or substantially all of its assets (other than by lease)) and whether or not the subsidiary guarantor is the surviving entity in such transaction to a person which is not Antero or a restricted subsidiary of Antero, such subsidiary guarantor will be released from its obligations under its subsidiary guarantee if the sale or other disposition does not violate the covenants set forth in the indentures governing the notes.
In addition, a subsidiary guarantor will be released from its obligations under the indentures and its guarantee, upon the release or discharge of the guarantee of other Indebtedness (as defined in the indentures governing the notes) that resulted in the creation of such guarantee, except a release or discharge by or as a result of payment under such guarantee; if Antero designates such subsidiary as an unrestricted subsidiary and such designation complies with the other applicable provisions of the indentures governing the notes or in connection with any covenant defeasance, legal defeasance or satisfaction and discharge of the notes.
The following Condensed Consolidating Balance Sheets at December 31, 2014 and 2015, and the related statements of operations and comprehensive income and statements cash flows for the years ended December 31, 2014 and 2015, present financial information for Antero on a stand‑alone basis (carrying its investment in wholly-owned subsidiaries using the equity method), financial information for the subsidiary guarantors, financial information for the non-guarantor subsidiaries, and the consolidation and elimination entries necessary to arrive at the information for the Company on a consolidated basis. Antero’s wholly-owned subsidiaries had no revenues, expenses, or cash flows during the year ended December 31, 2013, or for any year prior to 2013 and immaterial assets and liabilities at December 31, 2013. Antero’s wholly-owned subsidiaries are not restricted from making distributions to the Parent.
Table of Contents
ANTERO RESOURCES CORPORATION
Notes to Consolidated Financial Statements (Continued)
Years Ended December 31, 2013, 2014, and 2015
Condensed Consolidating Balance Sheet
December 31, 2014
(In thousands)
|
|
|
|
|
|
|
|
|
|
|
|
|
|
|
|
|
|
|
|
|
Parent
|
|
Guarantor
Subsidiaries
|
|
Non-Guarantor
Subsidiaries
|
|
Eliminations
|
|
Consolidated
|
|
|
Assets
|
|
|
|
|
|
|
|
|
|
|
|
|
|
|
|
|
|
Current assets:
|
|
|
|
|
|
|
|
|
|
|
|
|
|
|
|
|
|
Cash and cash equivalents
|
|
$
|
15,787
|
|
|
—
|
|
|
230,192
|
|
|
—
|
|
|
245,979
|
|
|
Accounts receivable, net
|
|
|
116,203
|
|
|
—
|
|
|
—
|
|
|
—
|
|
|
116,203
|
|
|
Intercompany receivables
|
|
|
1,380
|
|
|
—
|
|
|
17,646
|
|
|
(19,026)
|
|
|
—
|
|
|
Accrued revenue
|
|
|
191,558
|
|
|
—
|
|
|
—
|
|
|
—
|
|
|
191,558
|
|
|
Derivative instruments
|
|
|
692,554
|
|
|
—
|
|
|
—
|
|
|
—
|
|
|
692,554
|
|
|
Other current assets
|
|
|
5,348
|
|
|
1
|
|
|
518
|
|
|
(1)
|
|
|
5,866
|
|
|
Total current assets
|
|
|
1,022,830
|
|
|
1
|
|
|
248,356
|
|
|
(19,027)
|
|
|
1,252,160
|
|
|
Property and equipment:
|
|
|
|
|
|
|
|
|
|
|
|
|
|
|
|
|
|
Natural gas properties, at cost (successful efforts method):
|
|
|
|
|
|
|
|
|
|
|
|
|
|
|
|
|
|
Unproved properties
|
|
|
2,060,936
|
|
|
—
|
|
|
—
|
|
|
—
|
|
|
2,060,936
|
|
|
Proved properties
|
|
|
6,515,221
|
|
|
—
|
|
|
—
|
|
|
—
|
|
|
6,515,221
|
|
|
Water handling and treatment systems
|
|
|
421,012
|
|
|
—
|
|
|
—
|
|
|
—
|
|
|
421,012
|
|
|
Gathering systems and facilities
|
|
|
16,532
|
|
|
—
|
|
|
1,180,707
|
|
|
—
|
|
|
1,197,239
|
|
|
Other property and equipment
|
|
|
37,687
|
|
|
—
|
|
|
—
|
|
|
—
|
|
|
37,687
|
|
|
|
|
|
9,051,388
|
|
|
—
|
|
|
1,180,707
|
|
|
—
|
|
|
10,232,095
|
|
|
Less accumulated depletion, depreciation, and amortization
|
|
|
(828,533)
|
|
|
—
|
|
|
(51,110)
|
|
|
—
|
|
|
(879,643)
|
|
|
Property and equipment, net
|
|
|
8,222,855
|
|
|
—
|
|
|
1,129,597
|
|
|
—
|
|
|
9,352,452
|
|
|
Derivative instruments
|
|
|
899,997
|
|
|
—
|
|
|
—
|
|
|
—
|
|
|
899,997
|
|
|
Investments in subsidiaries
|
|
|
137,423
|
|
|
—
|
|
|
—
|
|
|
(137,423)
|
|
|
—
|
|
|
Other assets, net
|
|
|
51,718
|
|
|
—
|
|
|
17,168
|
|
|
—
|
|
|
68,886
|
|
|
Total assets
|
|
$
|
10,334,823
|
|
|
1
|
|
|
1,395,121
|
|
|
(156,450)
|
|
|
11,573,495
|
|
|
|
|
|
|
|
|
|
|
|
|
|
|
|
|
|
|
|
|
Liabilities and Equity
|
|
|
|
|
|
|
|
|
|
|
|
|
|
|
|
|
|
Current liabilities:
|
|
|
|
|
|
|
|
|
|
|
|
|
|
|
|
|
|
Accounts payable
|
|
$
|
485,628
|
|
|
—
|
|
|
45,936
|
|
|
—
|
|
|
531,564
|
|
|
Intercompany payable
|
|
|
17,646
|
|
|
—
|
|
|
1,380
|
|
|
(19,026)
|
|
|
—
|
|
|
Accrued liabilities
|
|
|
163,268
|
|
|
—
|
|
|
5,346
|
|
|
—
|
|
|
168,614
|
|
|
Revenue distributions payable
|
|
|
182,352
|
|
|
—
|
|
|
—
|
|
|
—
|
|
|
182,352
|
|
|
Other current liabilities
|
|
|
12,203
|
|
|
—
|
|
|
—
|
|
|
(1)
|
|
|
12,202
|
|
|
Total current liabilities
|
|
|
861,097
|
|
|
—
|
|
|
52,662
|
|
|
(19,027)
|
|
|
894,732
|
|
|
Long-term liabilities:
|
|
|
|
|
|
|
|
|
|
|
|
|
|
|
|
|
|
Long-term debt
|
|
|
4,247,550
|
|
|
115,000
|
|
|
—
|
|
|
—
|
|
|
4,362,550
|
|
|
Deferred income tax liability
|
|
|
794,796
|
|
|
—
|
|
|
—
|
|
|
—
|
|
|
794,796
|
|
|
Other liabilities
|
|
|
47,587
|
|
|
—
|
|
|
—
|
|
|
—
|
|
|
47,587
|
|
|
Total liabilities
|
|
|
5,951,030
|
|
|
115,000
|
|
|
52,662
|
|
|
(19,027)
|
|
|
6,099,665
|
|
|
Equity:
|
|
|
|
|
|
|
|
|
|
|
|
|
|
|
|
|
|
Stockholders' equity:
|
|
|
|
|
|
|
|
|
|
|
|
|
|
|
|
|
|
Parent net investment
|
|
|
—
|
|
|
(114,999)
|
|
|
—
|
|
|
114,999
|
|
|
—
|
|
|
Partners' capital
|
|
|
—
|
|
|
—
|
|
|
1,342,459
|
|
|
(1,342,459)
|
|
|
—
|
|
|
Common stock
|
|
|
2,621
|
|
|
—
|
|
|
—
|
|
|
—
|
|
|
2,621
|
|
|
Additional paid-in capital
|
|
|
3,513,725
|
|
|
—
|
|
|
—
|
|
|
—
|
|
|
3,513,725
|
|
|
Accumulated earnings
|
|
|
867,447
|
|
|
—
|
|
|
—
|
|
|
—
|
|
|
867,447
|
|
|
Total stockholders' equity
|
|
|
4,383,793
|
|
|
(114,999)
|
|
|
1,342,459
|
|
|
(1,227,460)
|
|
|
4,383,793
|
|
|
Noncontrolling interest in consolidated subsidiary
|
|
|
—
|
|
|
—
|
|
|
—
|
|
|
1,090,037
|
|
|
1,090,037
|
|
|
Total equity
|
|
|
4,383,793
|
|
|
(114,999)
|
|
|
1,342,459
|
|
|
(137,423)
|
|
|
5,473,830
|
|
|
Total liabilities and equity
|
|
$
|
10,334,823
|
|
|
1
|
|
|
1,395,121
|
|
|
(156,450)
|
|
|
11,573,495
|
|
Table of Contents
ANTERO RESOURCES CORPORATION
Notes to Consolidated Financial Statements (Continued)
Years Ended December 31, 2013, 2014, and 2015
Condensed Consolidating Balance Sheet
December 31, 2015
(In thousands)
|
|
|
|
|
|
|
|
|
|
|
|
|
|
|
|
|
|
|
|
|
Parent
|
|
Guarantor
Subsidiaries
|
|
Non-Guarantor
Subsidiaries
|
|
Eliminations
|
|
Consolidated
|
|
|
Assets
|
|
|
|
|
|
|
|
|
|
|
|
|
|
|
|
|
|
Current assets:
|
|
|
|
|
|
|
|
|
|
|
|
|
|
|
|
|
|
Cash and cash equivalents
|
|
$
|
16,590
|
|
|
—
|
|
|
6,883
|
|
|
—
|
|
|
23,473
|
|
|
Accounts receivable, net
|
|
|
76,697
|
|
|
—
|
|
|
2,707
|
|
|
—
|
|
|
79,404
|
|
|
Intercompany receivables
|
|
|
2,138
|
|
|
—
|
|
|
65,712
|
|
|
(67,850)
|
|
|
—
|
|
|
Accrued revenue
|
|
|
128,242
|
|
|
—
|
|
|
—
|
|
|
—
|
|
|
128,242
|
|
|
Derivative instruments
|
|
|
1,009,030
|
|
|
—
|
|
|
—
|
|
|
—
|
|
|
1,009,030
|
|
|
Other current assets
|
|
|
8,087
|
|
|
—
|
|
|
—
|
|
|
—
|
|
|
8,087
|
|
|
Total current assets
|
|
|
1,240,784
|
|
|
—
|
|
|
75,302
|
|
|
(67,850)
|
|
|
1,248,236
|
|
|
Property and equipment:
|
|
|
|
|
|
|
|
|
|
|
|
|
|
|
|
|
|
Natural gas properties, at cost (successful efforts method):
|
|
|
|
|
|
|
|
|
|
|
|
|
|
|
|
|
|
Unproved properties
|
|
|
1,996,081
|
|
|
—
|
|
|
—
|
|
|
—
|
|
|
1,996,081
|
|
|
Proved properties
|
|
|
8,243,901
|
|
|
—
|
|
|
—
|
|
|
(32,795)
|
|
|
8,211,106
|
|
|
Water handling and treatment systems
|
|
|
—
|
|
|
—
|
|
|
565,616
|
|
|
—
|
|
|
565,616
|
|
|
Gathering systems and facilities
|
|
|
16,561
|
|
|
—
|
|
|
1,485,835
|
|
|
—
|
|
|
1,502,396
|
|
|
Other property and equipment
|
|
|
46,415
|
|
|
—
|
|
|
—
|
|
|
—
|
|
|
46,415
|
|
|
|
|
|
10,302,958
|
|
|
—
|
|
|
2,051,451
|
|
|
(32,795)
|
|
|
12,321,614
|
|
|
Less accumulated depletion, depreciation, and amortization
|
|
|
(1,431,747)
|
|
|
—
|
|
|
(157,625)
|
|
|
—
|
|
|
(1,589,372)
|
|
|
Property and equipment, net
|
|
|
8,871,211
|
|
|
—
|
|
|
1,893,826
|
|
|
(32,795)
|
|
|
10,732,242
|
|
|
Derivative instruments
|
|
|
2,108,450
|
|
|
—
|
|
|
—
|
|
|
—
|
|
|
2,108,450
|
|
|
Investments in subsidiaries
|
|
|
(302,336)
|
|
|
—
|
|
|
—
|
|
|
302,336
|
|
|
—
|
|
|
Contingent acquisition consideration
|
|
|
178,049
|
|
|
—
|
|
|
—
|
|
|
(178,049)
|
|
|
—
|
|
|
Other assets, net
|
|
|
55,392
|
|
|
—
|
|
|
10,904
|
|
|
—
|
|
|
66,296
|
|
|
Total assets
|
|
$
|
12,151,550
|
|
|
—
|
|
|
1,980,032
|
|
|
23,642
|
|
|
14,155,224
|
|
|
|
|
|
|
|
|
|
|
|
|
|
|
|
|
|
|
|
|
Liabilities and Equity
|
|
|
|
|
|
|
|
|
|
|
|
|
|
|
|
|
|
Current liabilities:
|
|
|
|
|
|
|
|
|
|
|
|
|
|
|
|
|
|
Accounts payable
|
|
$
|
303,197
|
|
|
—
|
|
|
60,963
|
|
|
—
|
|
|
364,160
|
|
|
Intercompany payable
|
|
|
65,712
|
|
|
—
|
|
|
2,138
|
|
|
(67,850)
|
|
|
—
|
|
|
Accrued liabilities
|
|
|
158,713
|
|
|
—
|
|
|
35,363
|
|
|
—
|
|
|
194,076
|
|
|
Revenue distributions payable
|
|
|
129,949
|
|
|
—
|
|
|
—
|
|
|
—
|
|
|
129,949
|
|
|
Other current liabilities
|
|
|
18,935
|
|
|
—
|
|
|
150
|
|
|
—
|
|
|
19,085
|
|
|
Total current liabilities
|
|
|
676,506
|
|
|
—
|
|
|
98,614
|
|
|
(67,850)
|
|
|
707,270
|
|
|
Long-term liabilities:
|
|
|
|
|
|
|
|
|
|
|
|
|
|
|
|
|
|
Long-term debt
|
|
|
4,088,513
|
|
|
—
|
|
|
620,000
|
|
|
—
|
|
|
4,708,513
|
|
|
Deferred income tax liability
|
|
|
1,370,686
|
|
|
—
|
|
|
—
|
|
|
—
|
|
|
1,370,686
|
|
|
Contingent acquisition consideration
|
|
|
—
|
|
|
—
|
|
|
178,049
|
|
|
(178,049)
|
|
|
—
|
|
|
Other liabilities
|
|
|
81,453
|
|
|
—
|
|
|
624
|
|
|
—
|
|
|
82,077
|
|
|
Total liabilities
|
|
|
6,217,158
|
|
|
—
|
|
|
897,287
|
|
|
(245,899)
|
|
|
6,868,546
|
|
|
Equity:
|
|
|
|
|
|
|
|
|
|
|
|
|
|
|
|
|
|
Stockholders' equity:
|
|
|
|
|
|
|
|
|
|
|
|
|
|
|
|
|
|
Partners' capital
|
|
|
—
|
|
|
—
|
|
|
1,082,745
|
|
|
(1,082,745)
|
|
|
—
|
|
|
Common stock
|
|
|
2,770
|
|
|
—
|
|
|
—
|
|
|
—
|
|
|
2,770
|
|
|
Additional paid-in capital
|
|
|
4,122,811
|
|
|
—
|
|
|
—
|
|
|
—
|
|
|
4,122,811
|
|
|
Accumulated earnings
|
|
|
1,808,811
|
|
|
—
|
|
|
—
|
|
|
—
|
|
|
1,808,811
|
|
|
Total stockholders' equity
|
|
|
5,934,392
|
|
|
—
|
|
|
1,082,745
|
|
|
(1,082,745)
|
|
|
5,934,392
|
|
|
Noncontrolling interest in consolidated subsidiary
|
|
|
—
|
|
|
—
|
|
|
—
|
|
|
1,352,286
|
|
|
1,352,286
|
|
|
Total equity
|
|
|
5,934,392
|
|
|
—
|
|
|
1,082,745
|
|
|
269,541
|
|
|
7,286,678
|
|
|
Total liabilities and equity
|
|
$
|
12,151,550
|
|
|
—
|
|
|
1,980,032
|
|
|
23,642
|
|
|
14,155,224
|
|
Table of Contents
ANTERO RESOURCES CORPORATION
Notes to Consolidated Financial Statements (Continued)
Years Ended December 31, 2013, 2014, and 2015
Condensed Consolidating Statement of Operations and Comprehensive Income
Year Ended December 31, 2014
(In thousands)
|
|
|
|
|
|
|
|
|
|
|
|
|
|
|
|
|
|
|
|
|
Parent
|
|
Guarantor
Subsidiaries
|
|
Non-Guarantor
Subsidiaries
|
|
Eliminations
|
|
Consolidated
|
|
|
Revenue:
|
|
|
|
|
|
|
|
|
|
|
|
|
|
|
|
|
|
Natural gas sales
|
|
$
|
1,301,349
|
|
|
—
|
|
|
—
|
|
|
—
|
|
|
1,301,349
|
|
|
Natural gas liquids sales
|
|
|
328,323
|
|
|
—
|
|
|
—
|
|
|
—
|
|
|
328,323
|
|
|
Oil sales
|
|
|
107,080
|
|
|
—
|
|
|
—
|
|
|
—
|
|
|
107,080
|
|
|
Gathering, compression, and water handling and treatment
|
|
|
20,284
|
|
|
—
|
|
|
25,178
|
|
|
(23,387)
|
|
|
22,075
|
|
|
Marketing
|
|
|
53,604
|
|
|
—
|
|
|
—
|
|
|
—
|
|
|
53,604
|
|
|
Commodity derivative fair value gains
|
|
|
868,201
|
|
|
—
|
|
|
—
|
|
|
—
|
|
|
868,201
|
|
|
Gain on sale of gathering system
|
|
|
40,000
|
|
|
—
|
|
|
—
|
|
|
—
|
|
|
40,000
|
|
|
Other income
|
|
|
143
|
|
|
—
|
|
|
—
|
|
|
(143)
|
|
|
—
|
|
|
Total revenue
|
|
|
2,718,984
|
|
|
—
|
|
|
25,178
|
|
|
(23,530)
|
|
|
2,720,632
|
|
|
Operating expenses:
|
|
|
|
|
|
|
|
|
|
|
|
|
|
|
|
|
|
Lease operating
|
|
|
29,341
|
|
|
—
|
|
|
—
|
|
|
—
|
|
|
29,341
|
|
|
Gathering, compression, processing, and transportation
|
|
|
480,367
|
|
|
—
|
|
|
4,460
|
|
|
(23,414)
|
|
|
461,413
|
|
|
Production and ad valorem taxes
|
|
|
85,945
|
|
|
—
|
|
|
1,973
|
|
|
—
|
|
|
87,918
|
|
|
Marketing
|
|
|
103,435
|
|
|
—
|
|
|
—
|
|
|
—
|
|
|
103,435
|
|
|
Exploration
|
|
|
27,893
|
|
|
—
|
|
|
—
|
|
|
—
|
|
|
27,893
|
|
|
Impairment of unproved properties
|
|
|
15,198
|
|
|
—
|
|
|
—
|
|
|
—
|
|
|
15,198
|
|
|
Depletion, depreciation, and amortization
|
|
|
471,372
|
|
|
—
|
|
|
6,524
|
|
|
—
|
|
|
477,896
|
|
|
Accretion of asset retirement obligations
|
|
|
1,271
|
|
|
—
|
|
|
—
|
|
|
—
|
|
|
1,271
|
|
|
General and administrative
|
|
|
212,316
|
|
|
—
|
|
|
4,333
|
|
|
(116)
|
|
|
216,533
|
|
|
Total operating expenses
|
|
|
1,427,138
|
|
|
—
|
|
|
17,290
|
|
|
(23,530)
|
|
|
1,420,898
|
|
|
Operating income
|
|
|
1,291,846
|
|
|
—
|
|
|
7,888
|
|
|
—
|
|
|
1,299,734
|
|
|
Other income (expenses):
|
|
|
|
|
|
|
|
|
|
|
|
|
|
|
|
|
|
Interest
|
|
|
(159,585)
|
|
|
—
|
|
|
(466)
|
|
|
—
|
|
|
(160,051)
|
|
|
Loss on early extinguishment of debt
|
|
|
(20,386)
|
|
|
—
|
|
|
—
|
|
|
—
|
|
|
(20,386)
|
|
|
Equity in net income of subsidiaries
|
|
|
5,174
|
|
|
—
|
|
|
—
|
|
|
(5,174)
|
|
|
—
|
|
|
Total other expenses
|
|
|
(174,797)
|
|
|
—
|
|
|
(466)
|
|
|
(5,174)
|
|
|
(180,437)
|
|
|
Income before income taxes
|
|
|
1,117,049
|
|
|
—
|
|
|
7,422
|
|
|
(5,174)
|
|
|
1,119,297
|
|
|
Provision for income tax expense
|
|
|
(445,672)
|
|
|
—
|
|
|
—
|
|
|
—
|
|
|
(445,672)
|
|
|
Income from continuing operations
|
|
|
671,377
|
|
|
—
|
|
|
7,422
|
|
|
(5,174)
|
|
|
673,625
|
|
|
Discontinued operations:
|
|
|
|
|
|
|
|
|
|
|
|
|
|
|
|
|
|
Income from sale of discontinued operations, net of income taxes
|
|
|
2,210
|
|
|
—
|
|
|
—
|
|
|
—
|
|
|
2,210
|
|
|
Net income and comprehensive income including noncontrolling interest
|
|
|
673,587
|
|
|
—
|
|
|
7,422
|
|
|
(5,174)
|
|
|
675,835
|
|
|
Net income and comprehensive income attributable to noncontrolling interest
|
|
|
—
|
|
|
—
|
|
|
—
|
|
|
2,248
|
|
|
2,248
|
|
|
Net income and comprehensive income attributable to Antero Resources Corporation
|
|
$
|
673,587
|
|
|
—
|
|
|
7,422
|
|
|
(7,422)
|
|
|
673,587
|
|
Table of Contents
ANTERO RESOURCES CORPORATION
Notes to Consolidated Financial Statements (Continued)
Years Ended December 31, 2013, 2014, and 2015
Condensed Consolidating Statement of Operations and Comprehensive Income
Year Ended December 31, 2015
(In thousands)
|
|
|
|
|
|
|
|
|
|
|
|
|
|
|
|
|
|
|
|
|
Parent
|
|
Guarantor
Subsidiaries
|
|
Non-Guarantor
Subsidiaries
|
|
Eliminations
|
|
Consolidated
|
|
|
Revenue:
|
|
|
|
|
|
|
|
|
|
|
|
|
|
|
|
|
|
Natural gas sales
|
|
$
|
1,039,892
|
|
|
—
|
|
|
—
|
|
|
—
|
|
|
1,039,892
|
|
|
Natural gas liquids sales
|
|
|
264,483
|
|
|
—
|
|
|
—
|
|
|
—
|
|
|
264,483
|
|
|
Oil sales
|
|
|
70,753
|
|
|
—
|
|
|
—
|
|
|
—
|
|
|
70,753
|
|
|
Gathering, compression, and water handling and treatment
|
|
|
6,651
|
|
|
—
|
|
|
299,787
|
|
|
(284,438)
|
|
|
22,000
|
|
|
Marketing
|
|
|
176,229
|
|
|
—
|
|
|
—
|
|
|
—
|
|
|
176,229
|
|
|
Commodity derivative fair value gains
|
|
|
2,381,501
|
|
|
—
|
|
|
—
|
|
|
—
|
|
|
2,381,501
|
|
|
Other income
|
|
|
4,594
|
|
|
—
|
|
|
—
|
|
|
(4,594)
|
|
|
—
|
|
|
Total revenue
|
|
|
3,944,103
|
|
|
—
|
|
|
299,787
|
|
|
(289,032)
|
|
|
3,954,858
|
|
|
Operating expenses:
|
|
|
|
|
|
|
|
|
|
|
|
|
|
|
|
|
|
Lease operating
|
|
|
36,132
|
|
|
—
|
|
|
33,283
|
|
|
(33,404)
|
|
|
36,011
|
|
|
Gathering, compression, processing, and transportation
|
|
|
852,573
|
|
|
—
|
|
|
25,305
|
|
|
(218,517)
|
|
|
659,361
|
|
|
Production and ad valorem taxes
|
|
|
77,074
|
|
|
—
|
|
|
1,251
|
|
|
—
|
|
|
78,325
|
|
|
Marketing
|
|
|
299,062
|
|
|
—
|
|
|
—
|
|
|
—
|
|
|
299,062
|
|
|
Exploration
|
|
|
3,846
|
|
|
—
|
|
|
—
|
|
|
—
|
|
|
3,846
|
|
|
Impairment of unproved properties
|
|
|
104,321
|
|
|
—
|
|
|
—
|
|
|
—
|
|
|
104,321
|
|
|
Depletion, depreciation, and amortization
|
|
|
641,860
|
|
|
—
|
|
|
67,903
|
|
|
—
|
|
|
709,763
|
|
|
Accretion of asset retirement obligations
|
|
|
1,655
|
|
|
—
|
|
|
—
|
|
|
—
|
|
|
1,655
|
|
|
General and administrative
|
|
|
190,712
|
|
|
—
|
|
|
43,968
|
|
|
(983)
|
|
|
233,697
|
|
|
Contract termination and rig stacking
|
|
|
38,531
|
|
|
—
|
|
|
—
|
|
|
—
|
|
|
38,531
|
|
|
Accretion of contingent acquisition consideration
|
|
|
—
|
|
|
—
|
|
|
3,333
|
|
|
(3,333)
|
|
|
—
|
|
|
Total operating expenses
|
|
|
2,245,766
|
|
|
—
|
|
|
175,043
|
|
|
(256,237)
|
|
|
2,164,572
|
|
|
Operating income
|
|
|
1,698,337
|
|
|
—
|
|
|
124,744
|
|
|
(32,795)
|
|
|
1,790,286
|
|
|
Other income (expenses):
|
|
|
|
|
|
|
|
|
|
|
|
|
|
|
|
|
|
Interest
|
|
|
(228,568)
|
|
|
—
|
|
|
(5,832)
|
|
|
—
|
|
|
(234,400)
|
|
|
Equity in net income of subsidiaries
|
|
|
47,485
|
|
|
—
|
|
|
—
|
|
|
(47,485)
|
|
|
—
|
|
|
Total other expenses
|
|
|
(181,083)
|
|
|
—
|
|
|
(5,832)
|
|
|
(47,485)
|
|
|
(234,400)
|
|
|
Income before income taxes
|
|
|
1,517,254
|
|
|
—
|
|
|
118,912
|
|
|
(80,280)
|
|
|
1,555,886
|
|
|
Provision for income tax expense
|
|
|
(575,890)
|
|
|
—
|
|
|
—
|
|
|
—
|
|
|
(575,890)
|
|
|
Net income and comprehensive income including noncontrolling interest
|
|
|
941,364
|
|
|
—
|
|
|
118,912
|
|
|
(80,280)
|
|
|
979,996
|
|
|
Net income and comprehensive income attributable to noncontrolling interest
|
|
|
—
|
|
|
—
|
|
|
—
|
|
|
38,632
|
|
|
38,632
|
|
|
Net income and comprehensive income attributable to Antero Resources Corporation
|
|
$
|
941,364
|
|
|
—
|
|
|
118,912
|
|
|
(118,912)
|
|
|
941,364
|
|
Table of Contents
ANTERO RESOURCES CORPORATION
Notes to Consolidated Financial Statements (Continued)
Years Ended December 31, 2013, 2014, and 2015
Condensed Consolidating Statement of Cash Flows
Year Ended December 31, 2014
(In thousands)
|
|
|
|
|
|
|
|
|
|
|
|
|
|
|
|
|
|
|
|
|
Parent
|
|
Guarantor
Subsidiaries
|
|
Non-Guarantor
Subsidiaries
|
|
Eliminations
|
|
Consolidated
|
|
|
Net cash provided by operating activities
|
|
$
|
992,788
|
|
|
—
|
|
|
5,333
|
|
|
—
|
|
|
998,121
|
|
|
Cash flows used in investing activities:
|
|
|
|
|
|
|
|
|
|
|
|
|
|
|
|
|
|
Additions to proved properties
|
|
|
(64,066)
|
|
|
—
|
|
|
—
|
|
|
—
|
|
|
(64,066)
|
|
|
Additions to unproved properties
|
|
|
(777,422)
|
|
|
—
|
|
|
—
|
|
|
—
|
|
|
(777,422)
|
|
|
Drilling and completion costs
|
|
|
(2,477,150)
|
|
|
—
|
|
|
—
|
|
|
—
|
|
|
(2,477,150)
|
|
|
Additions to water handling and treatment systems
|
|
|
(196,675)
|
|
|
—
|
|
|
—
|
|
|
—
|
|
|
(196,675)
|
|
|
Additions to gathering systems and facilities
|
|
|
(543,196)
|
|
|
—
|
|
|
(14,841)
|
|
|
—
|
|
|
(558,037)
|
|
|
Additions to other property and equipment
|
|
|
(13,218)
|
|
|
—
|
|
|
—
|
|
|
—
|
|
|
(13,218)
|
|
|
Change in other assets
|
|
|
(2,928)
|
|
|
—
|
|
|
(154)
|
|
|
—
|
|
|
(3,082)
|
|
|
Net distributions from guarantor subsidiary
|
|
|
115,000
|
|
|
—
|
|
|
—
|
|
|
(115,000)
|
|
|
—
|
|
|
Distributions from non-guarantor subsidiary
|
|
|
332,500
|
|
|
—
|
|
|
—
|
|
|
(332,500)
|
|
|
—
|
|
|
Net cash used in investing activities
|
|
|
(3,627,155)
|
|
|
—
|
|
|
(14,995)
|
|
|
(447,500)
|
|
|
(4,089,650)
|
|
|
Cash flows provided by (used in) financing activities:
|
|
|
|
|
|
|
|
|
|
|
|
|
|
|
|
|
|
Issuance of common units in Antero Midstream Partners LP
|
|
|
—
|
|
|
—
|
|
|
1,087,224
|
|
|
—
|
|
|
1,087,224
|
|
|
Issuance of senior notes
|
|
|
1,102,500
|
|
|
—
|
|
|
—
|
|
|
—
|
|
|
1,102,500
|
|
|
Repayment of senior notes
|
|
|
(260,000)
|
|
|
—
|
|
|
—
|
|
|
—
|
|
|
(260,000)
|
|
|
Borrowings (repayments) on bank credit facility, net
|
|
|
1,837,000
|
|
|
115,000
|
|
|
(510,000)
|
|
|
—
|
|
|
1,442,000
|
|
|
Make-whole premium on debt extinguished
|
|
|
(17,383)
|
|
|
—
|
|
|
—
|
|
|
—
|
|
|
(17,383)
|
|
|
Payments of deferred financing costs
|
|
|
(26,673)
|
|
|
—
|
|
|
(4,870)
|
|
|
—
|
|
|
(31,543)
|
|
|
Distributions
|
|
|
—
|
|
|
(115,000)
|
|
|
(332,500)
|
|
|
447,500
|
|
|
—
|
|
|
Other
|
|
|
(2,777)
|
|
|
—
|
|
|
—
|
|
|
—
|
|
|
(2,777)
|
|
|
Net cash provided by (used in) financing activities
|
|
|
2,632,667
|
|
|
—
|
|
|
239,854
|
|
|
447,500
|
|
|
3,320,021
|
|
|
Net increase (decrease) in cash and cash equivalents
|
|
|
(1,700)
|
|
|
—
|
|
|
230,192
|
|
|
—
|
|
|
228,492
|
|
|
Cash and cash equivalents, beginning of period
|
|
|
17,487
|
|
|
—
|
|
|
—
|
|
|
—
|
|
|
17,487
|
|
|
Cash and cash equivalents, end of period
|
|
$
|
15,787
|
|
|
—
|
|
|
230,192
|
|
|
—
|
|
|
245,979
|
|
Table of Contents
ANTERO RESOURCES CORPORATION
Notes to Consolidated Financial Statements (Continued)
Years Ended December 31, 2013, 2014, and 2015
Condensed Consolidating Statement of Cash Flows
Year Ended December 31, 2015
(In thousands)
|
|
|
|
|
|
|
|
|
|
|
|
|
|
|
|
|
|
|
|
|
Parent
|
|
Guarantor
Subsidiaries
|
|
Non-Guarantor
Subsidiaries
|
|
Eliminations
|
|
Consolidated
|
|
|
Net cash provided by operating activities
|
|
$
|
816,128
|
|
|
—
|
|
|
190,253
|
|
|
—
|
|
|
1,006,381
|
|
|
Cash flows used in investing activities:
|
|
|
|
|
|
|
|
|
|
|
|
|
|
|
|
|
|
Additions to unproved properties
|
|
|
(198,694)
|
|
|
—
|
|
|
—
|
|
|
—
|
|
|
(198,694)
|
|
|
Drilling and completion costs
|
|
|
(1,651,282)
|
|
|
—
|
|
|
—
|
|
|
—
|
|
|
(1,651,282)
|
|
|
Additions to water handling and treatment systems
|
|
|
(80,064)
|
|
|
—
|
|
|
(50,987)
|
|
|
—
|
|
|
(131,051)
|
|
|
Additions to gathering systems and facilities
|
|
|
(40,285)
|
|
|
—
|
|
|
(320,002)
|
|
|
—
|
|
|
(360,287)
|
|
|
Additions to other property and equipment
|
|
|
(6,595)
|
|
|
—
|
|
|
—
|
|
|
—
|
|
|
(6,595)
|
|
|
Change in other assets
|
|
|
2,570
|
|
|
—
|
|
|
7,180
|
|
|
—
|
|
|
9,750
|
|
|
Net distributions from guarantor subsidiary
|
|
|
(115,000)
|
|
|
—
|
|
|
—
|
|
|
115,000
|
|
|
—
|
|
|
Distributions from non-guarantor subsidiary
|
|
|
73,119
|
|
|
—
|
|
|
—
|
|
|
(73,119)
|
|
|
—
|
|
|
Proceeds from contribution of assets to non-guarantor subsidiary
|
|
|
801,116
|
|
|
—
|
|
|
—
|
|
|
(801,116)
|
|
|
—
|
|
|
Proceeds from asset sales
|
|
|
40,000
|
|
|
—
|
|
|
—
|
|
|
—
|
|
|
40,000
|
|
|
Net cash used in investing activities
|
|
|
(1,175,115)
|
|
|
—
|
|
|
(363,809)
|
|
|
(759,235)
|
|
|
(2,298,159)
|
|
|
Cash flows provided by (used in) financing activities:
|
|
|
|
|
|
|
|
|
|
|
|
|
|
|
|
|
|
Issuance of common stock
|
|
|
537,832
|
|
|
—
|
|
|
—
|
|
|
—
|
|
|
537,832
|
|
|
Issuance of common units in Antero Midstream Partners LP
|
|
|
—
|
|
|
—
|
|
|
240,703
|
|
|
—
|
|
|
240,703
|
|
|
Issuance of senior notes
|
|
|
750,000
|
|
|
—
|
|
|
—
|
|
|
—
|
|
|
750,000
|
|
|
Borrowings (repayments) on bank credit facility, net
|
|
|
(908,000)
|
|
|
(115,000)
|
|
|
620,000
|
|
|
—
|
|
|
(403,000)
|
|
|
Payments of deferred financing costs
|
|
|
(15,234)
|
|
|
—
|
|
|
(2,059)
|
|
|
—
|
|
|
(17,293)
|
|
|
Distributions
|
|
|
—
|
|
|
115,000
|
|
|
(908,364)
|
|
|
759,235
|
|
|
(34,129)
|
|
|
Other
|
|
|
(4,808)
|
|
|
—
|
|
|
(33)
|
|
|
—
|
|
|
(4,841)
|
|
|
Net cash provided by (used in) financing activities
|
|
|
359,790
|
|
|
—
|
|
|
(49,753)
|
|
|
759,235
|
|
|
1,069,272
|
|
|
Net increase (decrease) in cash and cash equivalents
|
|
|
803
|
|
|
—
|
|
|
(223,309)
|
|
|
—
|
|
|
(222,506)
|
|
|
Cash and cash equivalents, beginning of period
|
|
|
15,787
|
|
|
—
|
|
|
230,192
|
|
|
—
|
|
|
245,979
|
|
|
Cash and cash equivalents, end of period
|
|
$
|
16,590
|
|
|
—
|
|
|
6,883
|
|
|
—
|
|
|
23,473
|
|
Table of Contents
ANTERO RESOURCES CORPORATION
Notes to Consolidated Financial Statements (Continued)
Years Ended December 31, 2013, 2014, and 2015
(17) Quarterly Financial Information (Unaudited)
The Company’s quarterly consolidated financial information for the years ended December 31, 2014 and 2015 is summarized in the following table (in thousands, except per share amounts). The Company’s quarterly operating results are affected by the volatility of commodity prices and the resulting effect on our production revenues and the fair value of commodity derivatives.
|
|
|
|
|
|
|
|
|
|
|
|
|
|
|
|
|
|
First
quarter
|
|
Second
quarter
|
|
Third
quarter
|
|
Fourth
quarter
|
|
|
Year Ended December 31, 2014:
|
|
|
|
|
|
|
|
|
|
|
|
|
|
|
Total operating revenues
|
|
$
|
164,981
|
|
$
|
311,338
|
|
$
|
762,490
|
|
$
|
1,481,823
|
|
|
Total operating expenses
|
|
|
269,060
|
|
|
316,641
|
|
|
381,091
|
|
|
454,106
|
|
|
Operating income (loss)
|
|
|
(104,079)
|
|
|
(5,303)
|
|
|
381,399
|
|
|
1,027,717
|
|
|
Income (loss) from continuing operations
|
|
|
(94,759)
|
|
|
(44,495)
|
|
|
203,909
|
|
|
608,970
|
|
|
Income from discontinued operations
|
|
|
—
|
|
|
2,210
|
|
|
—
|
|
|
—
|
|
|
Net income (loss) and comprehensive income (loss) including noncontrolling interest
|
|
|
(94,759)
|
|
|
(42,285)
|
|
|
203,909
|
|
|
608,970
|
|
|
Net income attributable to noncontrolling interest
|
|
|
—
|
|
|
—
|
|
|
—
|
|
|
2,248
|
|
|
Net income (loss) attributable to Antero Resources Corporation
|
|
|
(94,759)
|
|
|
(42,285)
|
|
|
203,909
|
|
|
606,722
|
|
|
Earnings (loss) per common share:
|
|
|
|
|
|
|
|
|
|
|
|
|
|
|
Continuing operations
|
|
$
|
(0.36)
|
|
$
|
(0.17)
|
|
$
|
0.78
|
|
$
|
2.31
|
|
|
Discontinued operations
|
|
|
—
|
|
|
0.01
|
|
|
—
|
|
|
—
|
|
|
Net income (loss)
|
|
$
|
(0.36)
|
|
$
|
(0.16)
|
|
$
|
0.78
|
|
$
|
2.31
|
|
|
Earnings (loss) per common share—diluted:
|
|
|
|
|
|
|
|
|
|
|
|
|
|
|
Continuing operations
|
|
$
|
(0.36)
|
|
$
|
(0.17)
|
|
$
|
0.78
|
|
$
|
2.31
|
|
|
Discontinued operations
|
|
|
—
|
|
|
0.01
|
|
|
—
|
|
|
—
|
|
|
Net income (loss)
|
|
$
|
(0.36)
|
|
$
|
(0.16)
|
|
$
|
0.78
|
|
$
|
2.31
|
|
|
|
|
|
|
|
|
|
|
|
|
|
|
|
|
|
|
|
First
quarter
|
|
Second
quarter
|
|
Third
quarter
|
|
Fourth
quarter
|
|
|
Year Ended December 31, 2015:
|
|
|
|
|
|
|
|
|
|
|
|
|
|
|
Total operating revenues
|
|
$
|
1,229,687
|
|
$
|
376,714
|
|
$
|
1,443,335
|
|
$
|
905,122
|
|
|
Total operating expenses
|
|
|
529,993
|
|
|
540,463
|
|
|
502,220
|
|
|
591,896
|
|
|
Operating income (loss)
|
|
|
699,694
|
|
|
(163,749)
|
|
|
941,115
|
|
|
313,226
|
|
|
Income (loss) from continuing operations
|
|
|
399,171
|
|
|
(139,483)
|
|
|
544,734
|
|
|
175,574
|
|
|
Net income (loss) and comprehensive income (loss) including noncontrolling interest
|
|
|
399,171
|
|
|
(139,483)
|
|
|
544,734
|
|
|
175,574
|
|
|
Net income attributable to noncontrolling interest
|
|
|
4,740
|
|
|
5,890
|
|
|
10,892
|
|
|
17,110
|
|
|
Net income (loss) attributable to Antero Resources Corporation
|
|
|
394,431
|
|
|
(145,373)
|
|
|
533,842
|
|
|
158,464
|
|
|
|
|
|
|
|
|
|
|
|
|
|
|
|
|
|
Earnings (loss) per common share
|
|
$
|
1.49
|
|
$
|
(0.52)
|
|
$
|
1.93
|
|
$
|
0.57
|
|
|
|
|
|
|
|
|
|
|
|
|
|
|
|
|
|
Earnings (loss) per common share—diluted
|
|
$
|
1.49
|
|
$
|
(0.52)
|
|
$
|
1.93
|
|
$
|
0.57
|
|
(18) Supplemental Information on Oil and Gas Producing Activities (Unaudited)
The following is supplemental information regarding the Company’s consolidated oil and gas producing activities. The amounts shown include the Company’s net working interests in all of its oil and gas properties.
Table of Contents
ANTERO RESOURCES CORPORATION
Notes to Consolidated Financial Statements (Continued)
Years Ended December 31, 2013, 2014, and 2015
(a) Capitalized Costs Relating to Oil and Gas Producing Activities
|
|
|
|
|
|
|
|
|
|
|
|
Year ended December 31,
|
|
|
(In thousands)
|
|
2014
|
|
2015
|
|
|
Proved properties
|
|
$
|
6,515,221
|
|
$
|
8,211,106
|
|
|
Unproved properties
|
|
|
2,060,936
|
|
|
1,996,081
|
|
|
|
|
|
8,576,157
|
|
|
10,207,187
|
|
|
Accumulated depletion and depreciation
|
|
|
(802,665)
|
|
|
(1,415,005)
|
|
|
Net capitalized costs
|
|
$
|
7,773,492
|
|
$
|
8,792,182
|
|
(b) Costs Incurred in Certain Oil and Gas Activities
|
|
|
|
|
|
|
|
|
|
|
|
|
|
|
Year ended December 31,
|
|
|
(In thousands)
|
|
2013
|
|
2014
|
|
2015
|
|
|
Acquisition costs:
|
|
|
|
|
|
|
|
|
|
|
|
Proved property
|
|
$
|
15,300
|
|
$
|
64,066
|
|
$
|
—
|
|
|
Unproved property
|
|
|
440,825
|
|
|
777,422
|
|
|
198,694
|
|
|
Development costs
|
|
|
780,583
|
|
|
1,536,193
|
|
|
1,039,301
|
|
|
Exploration costs
|
|
|
835,382
|
|
|
940,957
|
|
|
611,981
|
|
|
Total costs incurred
|
|
$
|
2,072,090
|
|
$
|
3,318,638
|
|
$
|
1,849,976
|
|
(c) Results of Operations for Oil and Gas Producing Activities
|
|
|
|
|
|
|
|
|
|
|
|
|
|
|
Year ended December 31,
|
|
|
(In thousands)
|
|
2013
|
|
2014
|
|
2015
|
|
|
Revenues
|
|
$
|
821,445
|
|
$
|
1,736,752
|
|
$
|
1,375,128
|
|
|
Operating expenses:
|
|
|
|
|
|
|
|
|
|
|
|
Production expenses
|
|
|
278,348
|
|
|
578,672
|
|
|
773,697
|
|
|
Exploration expenses
|
|
|
22,272
|
|
|
27,893
|
|
|
3,846
|
|
|
Depletion and depreciation
|
|
|
219,830
|
|
|
418,744
|
|
|
614,700
|
|
|
Impairment of unproved properties
|
|
|
10,928
|
|
|
15,198
|
|
|
104,321
|
|
|
Results of operations before income tax expense
|
|
|
290,067
|
|
|
696,245
|
|
|
(121,436)
|
|
|
Income tax expense
|
|
|
(110,805)
|
|
|
(263,126)
|
|
|
45,497
|
|
|
Results of operations
|
|
$
|
179,262
|
|
$
|
433,119
|
|
$
|
(75,939)
|
|
(d) Oil and Gas Reserves
The following table sets forth the net quantities of proved reserves and proved developed reserves during the periods indicated. This information includes the oil and gas segment’s royalty and net working interest share of the reserves in oil and gas properties. Net proved oil and gas reserves for the year ended December 31, 2013, 2014, and 2015 were prepared by the Company’s reserve engineers and audited by DeGolyer and MacNaughton (D&M) utilizing data compiled by the Company. There are many uncertainties inherent in estimating proved reserve quantities, and projecting future production rates and timing of future development costs. In addition, reserve estimates of new discoveries are more imprecise than those of properties with a production history. Accordingly, these estimates are subject to change as additional information becomes available. All reserves are located in the United States.
Proved reserves are the estimated quantities of crude oil, condensate, and natural gas that geological and engineering data demonstrate with reasonable certainty to be recoverable in future years from known oil and gas reservoirs under existing economic and operating conditions at the end of the respective years. Proved developed reserves are those reserves expected to be recovered through existing wells with existing equipment and operating methods. The Company estimates proved reserves using average prices received for the previous 12 months.
Proved undeveloped reserves include drilling locations that are more than one offset location away from productive wells and are reasonably certain of containing proved reserves and which are scheduled to be drilled within five years under the Company’s development plans. The Company’s development plans for drilling scheduled over the next five years are subject to many
Table of Contents
ANTERO RESOURCES CORPORATION
Notes to Consolidated Financial Statements (Continued)
Years Ended December 31, 2013, 2014, and 2015
uncertainties and variables, including availability of capital; future oil and gas prices; and cash flows from operations, future drilling costs, demand for natural gas, and other economic factors.
|
|
|
|
|
|
|
|
|
|
|
|
|
|
|
|
|
Natural
gas
(Bcf)
|
|
|
NGLs
(MMBbl)
|
|
|
Oil and
condensate
(MMBbl)
|
|
|
Equivalents
(Bcfe)
|
|
|
Proved reserves:
|
|
|
|
|
|
|
|
|
|
|
|
|
|
December 31, 2012
|
|
3,694
|
|
|
203
|
|
|
3
|
|
|
4,929
|
|
|
Revisions
|
|
152
|
|
|
(140)
|
|
|
—
|
(a)
|
|
(788)
|
|
|
Extensions, discoveries and other additions
|
|
3,084
|
|
|
76
|
|
|
7
|
|
|
3,682
|
|
|
Production
|
|
(177)
|
|
|
(2)
|
|
|
—
|
(a)
|
|
(191)
|
|
|
December 31, 2013
|
|
6,753
|
|
|
137
|
|
|
10
|
|
|
7,632
|
|
|
Revisions
|
|
(1,025)
|
|
|
(6)
|
|
|
—
|
(a)
|
|
(1,054)
|
|
|
Extensions, discoveries and other additions
|
|
5,095
|
|
|
206
|
|
|
19
|
|
|
6,444
|
|
|
Purchases
|
|
29
|
|
|
—
|
|
|
—
|
|
|
29
|
|
|
Production
|
|
(317)
|
|
|
(7)
|
|
|
(1)
|
|
|
(368)
|
|
|
December 31, 2014
|
|
10,535
|
|
|
330
|
|
|
28
|
|
|
12,683
|
|
|
Revisions
|
|
(2,816)
|
|
|
176
|
|
|
(8)
|
|
|
(1,801)
|
|
|
Extensions, discoveries and other additions
|
|
2,253
|
|
|
97
|
|
|
8
|
|
|
2,878
|
|
|
Production
|
|
(439)
|
|
|
(16)
|
|
|
(2)
|
|
|
(545)
|
|
|
December 31, 2015
|
|
9,533
|
|
|
587
|
|
|
26
|
|
|
13,215
|
|
|
|
|
|
|
|
|
|
|
|
|
|
|
|
Natural
gas
(Bcf)
|
|
NGLs
(MMBbl)
|
|
Oil and
condensate
(MMBbl)
|
|
Equivalents
(Bcfe)
|
|
|
Proved developed reserves:
|
|
|
|
|
|
|
|
|
|
|
December 31, 2013
|
|
1,818
|
|
33
|
|
2
|
|
2,022
|
|
|
December 31, 2014
|
|
3,285
|
|
80
|
|
6
|
|
3,803
|
|
|
December 31, 2015
|
|
3,627
|
|
360
|
|
8
|
|
5,838
|
|
|
Proved undeveloped reserves:
|
|
|
|
|
|
|
|
|
|
|
December 31, 2013
|
|
4,936
|
|
105
|
|
8
|
|
5,610
|
|
|
December 31, 2014
|
|
7,250
|
|
250
|
|
22
|
|
8,880
|
|
|
December 31, 2015
|
|
5,906
|
|
227
|
|
18
|
|
7,377
|
|
Significant items included in the categories of proved developed and undeveloped reserve changes for the years 2013, 2014, and 2015 in the above table include the following:
2013 Changes in Reserves
|
·
| |
Extensions, discoveries, and other additions during 2013 of 3,682 Bcfe were added through exploratory and developmental drilling in the Marcellus and Utica Shales. |
|
·
| |
Downward revisions of 788 Bcfe resulted from changing the underlying production assumption used to estimate reserves to ethane rejection at December 31, 2013 from ethane recovery at December 31, 2012 as well as the reclassification of certain wells to the probable reserves category in 2013 because they are no longer expected to be drilled within five years of initial booking. |
2014 Changes in Reserves
|
·
| |
2014— Extensions, discoveries, and other additions during 2014 of 6,444 Bcfe were added through exploratory and developmental drilling in the Marcellus and Utica Shales. |
|
·
| |
Purchases of 29 Bcfe relate to 5 horizontal producing wells acquired as part of our leasehold acquisition efforts. |
Table of Contents
ANTERO RESOURCES CORPORATION
Notes to Consolidated Financial Statements (Continued)
Years Ended December 31, 2013, 2014, and 2015
|
·
| |
Upward performance revisions of 361 Bcfe relate to improved well performance from shorter stage length completions. |
|
·
| |
Downward revisions of 1,417 Bcfe due were due to the reclassification of 191 dry gas locations to the probable category because they were no longer expected to be drilled within five years of initial booking. |
|
·
| |
Upward price revisions of 2 Bcfe were due to increases in the reference price for natural gas, partially offset by decreases in the prices for NGLs and oil. |
2015 Changes in Reserves
|
·
| |
Extensions, discoveries, and other additions of 2,878 Bcfe resulted from delineation and development drilling in both the Marcellus and Utica Shales. |
|
·
| |
Upward revisions of 1,091 Bcfe due to partial ethane recovery is a result of changing from ethane rejection at December 31, 2014 to partial ethane recovery in 2015. In 2015, we began ethane recovery and changed our underlying production assumptions to the recovery of approximately 11,500 gross barrels per day of ethane at December 31, 2015. |
|
·
| |
Negative performance revisions of 358 Bcfe resulted from the revised statistical analysis of reserves based on actual production results. |
|
·
| |
Negative revisions of 2,332 Bcfe were due to the SEC 5-year development rule because we no longer expect certain locations in the eastern portion of our Marcellus acreage containing primarily dry gas to be developed within five years. |
|
·
| |
Negative revisions of 202 Bcfe were due to the decreases in prices for natural gas, NGLs, and oil. |
The following table sets forth the standardized measure of the discounted future net cash flows attributable to the Company’s proved reserves. Future cash inflows were computed by applying historical 12 month unweighted first day of the month average prices. Future prices actually received may materially differ from current prices or the prices used in the standardized measure.
Future production and development costs represent the estimated future expenditures (based on current costs) to be incurred in developing and producing the proved reserves, assuming continuation of existing economic conditions. Future income tax expenses were computed by applying statutory income tax rates to the difference between pretax net cash flows relating to the Company’s proved reserves and the tax basis of proved oil and gas properties. In addition, the effects of available net operating loss carryforwards and alternative minimum tax credits were used in computing future income tax expense. The resulting annual net cash inflows were then discounted using a 10% annual rate.
|
|
|
|
|
|
|
|
|
|
|
|
|
|
|
Year ended December 31,
|
|
|
(in millions)
|
|
2013
|
|
2014
|
|
2015
|
|
|
Future cash inflows
|
|
$
|
30,113
|
|
$
|
63,632
|
|
$
|
35,179
|
|
|
Future production costs
|
|
|
(5,967)
|
|
|
(21,722)
|
|
|
(17,393)
|
|
|
Future development costs
|
|
|
(5,349)
|
|
|
(8,212)
|
|
|
(5,217)
|
|
|
Future net cash flows before income tax
|
|
|
18,797
|
|
|
33,698
|
|
|
12,569
|
|
|
Future income tax expense
|
|
|
(5,308)
|
|
|
(10,726)
|
|
|
(1,708)
|
|
|
Future net cash flows
|
|
|
13,489
|
|
|
22,972
|
|
|
10,861
|
|
|
10% annual discount for estimated timing of cash flows
|
|
|
(8,979)
|
|
|
(15,337)
|
|
|
(7,628)
|
|
|
Standardized measure of discounted future net cash flows
|
|
$
|
4,510
|
|
$
|
7,635
|
|
$
|
3,233
|
|
The 12‑month weighted average prices used to estimate the Company’s total equivalent reserves were as follows (per Mcfe):
|
|
|
|
|
|
|
December 31, 2013
|
|
$
|
3.95
|
|
|
December 31, 2014
|
|
$
|
5.02
|
|
|
December 31, 2015
|
|
$
|
2.66
|
|
Table of Contents
ANTERO RESOURCES CORPORATION
Notes to Consolidated Financial Statements (Continued)
Years Ended December 31, 2013, 2014, and 2015
(f) Changes in Standardized Measure of Discounted Future Net Cash Flow
|
|
|
|
|
|
|
|
|
|
|
|
|
|
|
Year ended December 31,
|
|
|
(in millions)
|
|
2013
|
|
2014
|
|
2015
|
|
|
Sales of oil and gas, net of productions costs
|
|
$
|
(543)
|
|
$
|
(1,158)
|
|
$
|
(601)
|
|
|
Net changes in prices and production costs
|
|
|
1,061
|
|
|
(184)
|
|
|
(9,416)
|
|
|
Development costs incurred during the period
|
|
|
384
|
|
|
564
|
|
|
769
|
|
|
Net changes in future development costs
|
|
|
(181)
|
|
|
(102)
|
|
|
671
|
|
|
Extensions, discoveries and other additions
|
|
|
3,441
|
|
|
5,759
|
|
|
861
|
|
|
Acquisitions
|
|
|
2
|
|
|
42
|
|
|
—
|
|
|
Revisions of previous quantity estimates
|
|
|
(270)
|
|
|
(828)
|
|
|
(1,167)
|
|
|
Accretion of discount
|
|
|
192
|
|
|
600
|
|
|
1,132
|
|
|
Net change in income taxes
|
|
|
(1,165)
|
|
|
(2,198)
|
|
|
3,284
|
|
|
Other changes
|
|
|
(12)
|
|
|
630
|
|
|
65
|
|
|
Net increase (decrease)
|
|
|
2,909
|
|
|
3,125
|
|
|
(4,402)
|
|
|
Beginning of year
|
|
|
1,601
|
|
|
4,510
|
|
|
7,635
|
|
|
End of year
|
|
$
|
4,510
|
|
$
|
7,635
|
|
$
|
3,233
|
|